# Leonardo DRS operating profit outpaces sales in Q3

Canonical: https://tgos.io/earnings/drs-2026-q3/analysis/

<article class="assess ax-earnings-drs-2026-q3"><p class="kicker">Earnings analysis</p><h1>Leonardo DRS operating profit outpaces sales in Q3</h1><p class="dek">Contract-estimate changes explain less of the quarterly profit gain than the nine-month increase. A tax benefit lifts EPS, while cash conversion depends on Q4.</p><p class="byline"><time datetime="2026-11-04">November 4, 2026</time></p><details class="assessment-contents"><summary>In this analysis</summary><nav aria-label="In this analysis"><ol><li><a href="#section-earnings-drs-2026-q3-1">Contract-estimate changes explain less of the quarterly profit gain</a></li><li><a href="#section-earnings-drs-2026-q3-2">DRS&#x27;s quarterly profit gain depends less on estimate changes</a></li><li><a href="#section-earnings-drs-2026-q3-3">The tax benefit also lifts adjusted EPS</a></li><li><a href="#section-earnings-drs-2026-q3-4">IMS earns more operating profit on a smaller revenue base</a></li><li><a href="#section-earnings-drs-2026-q3-5">DRS&#x27;s smaller IMS segment earns more operating profit</a></li><li><a href="#section-earnings-drs-2026-q3-6">IMS growth comes with a different contract mix</a></li><li><a href="#section-earnings-drs-2026-q3-7">DRS&#x27;s IMS flexibly priced revenue rises as fixed-price revenue falls</a></li><li><a href="#section-earnings-drs-2026-q3-8">Research spending rises unevenly across the business</a></li><li><a href="#section-earnings-drs-2026-q3-9">Funded backlog grows faster than the total order book</a></li><li><a href="#section-earnings-drs-2026-q3-10">DRS&#x27;s backlog contains a larger funded share</a></li><li><a href="#section-earnings-drs-2026-q3-11">Cash improves over nine months but trails the quarterly earnings gain</a></li><li><a href="#section-earnings-drs-2026-q3-12">DRS&#x27;s prior year relied on a large Q4 cash inflow</a></li><li><a href="#section-earnings-drs-2026-q3-13">Raft adds a pending cash commitment</a></li><li><a href="#section-earnings-drs-2026-q3-14">The raised outlook still requires a large fourth quarter</a></li><li><a href="#section-earnings-drs-2026-q3-15">DRS&#x27;s profit outlook climbs through 2026</a></li></ol></nav></details><header class="article-header"></header><article class="story"><p>Leonardo DRS turned higher sales into a faster increase in operating profit in the quarter ended Sept. 30, 2026.  Revenue rose 11.0% to $1,066 million, while GAAP operating earnings increased 24.7% to $116 million. <sup class="refs"><a id="ref-source-1-1" href="#src-earnings-drs-2026-q3-1" aria-label="Source 1">1</a></sup></p>
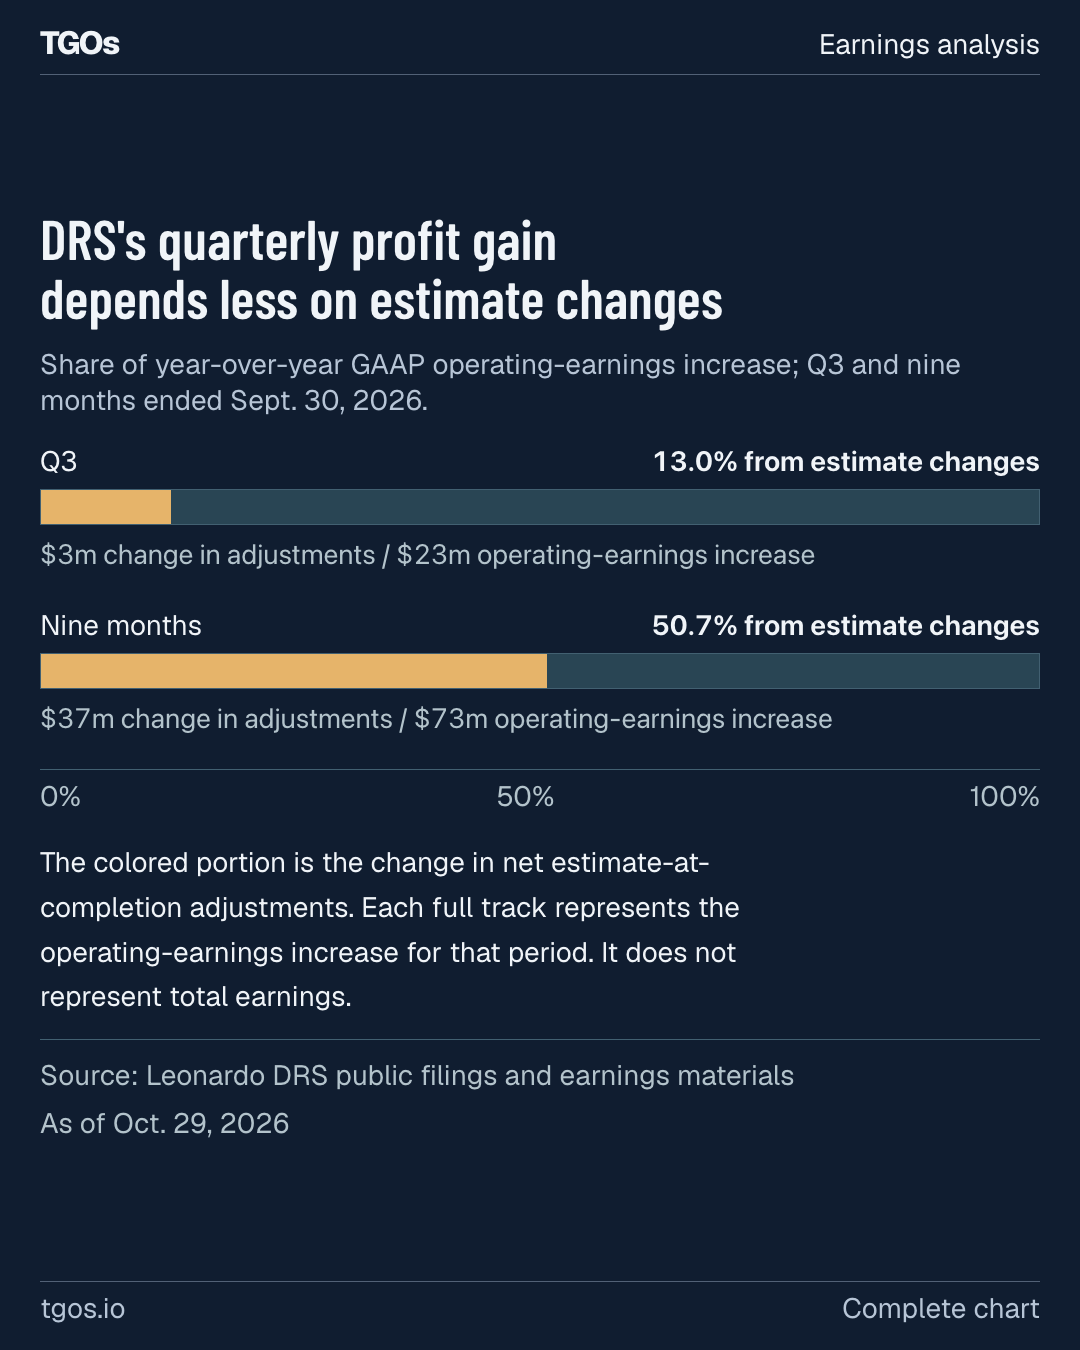
<p>The distinction is how much of that improvement came from revised contract estimates. Their contribution to the quarterly operating-earnings increase was much smaller than their contribution to the nine-month gain. <sup class="refs"><a id="ref-source-1-2" href="#src-earnings-drs-2026-q3-1" aria-label="Source 1">1</a>,<a id="ref-source-2-1" href="#src-earnings-drs-2026-q3-2" aria-label="Source 2">2</a></sup> Cash conversion presents a separate test: free cash flow remained negative through September despite higher earnings. <sup class="refs"><a id="ref-source-1-3" href="#src-earnings-drs-2026-q3-1" aria-label="Source 1">1</a></sup></p>
<p>DRS describes the quarter&#x27;s revenue growth as organic and credits tactical radars, naval power and propulsion, and progress on space sensing programs. <sup class="refs"><a id="ref-source-1-4" href="#src-earnings-drs-2026-q3-1" aria-label="Source 1">1</a>,<a id="ref-source-8-1" href="#src-earnings-drs-2026-q3-8" aria-label="Source 8">8</a></sup> Consolidated Adjusted EBITDA margin reached 14.0%, matching Q2 after 12.4% in Q1; this is a non-GAAP measure. <sup class="refs"><a id="ref-source-1-5" href="#src-earnings-drs-2026-q3-1" aria-label="Source 1">1</a>,<a id="ref-source-4-1" href="#src-earnings-drs-2026-q3-4" aria-label="Source 4">4</a>,<a id="ref-source-5-1" href="#src-earnings-drs-2026-q3-5" aria-label="Source 5">5</a></sup></p>
<h2 id="section-earnings-drs-2026-q3-1">Contract-estimate changes explain less of the quarterly profit gain</h2>
<p>Contract accounting recognizes cumulative catch-up adjustments when estimates of a program&#x27;s economics change. DRS attributes its adjustments primarily to fixed-price programs.  Those adjustments affect revenue and operating earnings equally, so the estimate changes also form part of reported sales growth. <sup class="refs"><a id="ref-source-2-2" href="#src-earnings-drs-2026-q3-2" aria-label="Source 2">2</a></sup></p>
<figure id="estimate-changes" class="gfx peak"><figcaption><h2 id="section-earnings-drs-2026-q3-2">DRS&#x27;s quarterly profit gain depends less on estimate changes</h2><p class="chart-subtitle">Share of year-over-year GAAP operating-earnings increase; Q3 and nine months ended Sept. 30, 2026.</p></figcaption><div class="plot" role="img" aria-label="DRS&#x27;s quarterly profit gain depends less on estimate changes. Share of year-over-year GAAP operating-earnings increase; Q3 and nine months ended Sept. 30, 2026. Period: Q3, Operating-earnings increase ($m): 23, Change in net estimate adjustments ($m): 3, Share of increase: 13.0%; Period: Nine months, Operating-earnings increase ($m): 73, Change in net estimate adjustments ($m): 37, Share of increase: 50.7%."><div class="chart-row"><div class="row-head"><span>Q3</span><strong>13.0% from estimate changes</strong></div><div class="track share-track"><span class="fill gold" style="width:13.0%"></span></div><div class="row-detail">$3m change in adjustments / $23m operating-earnings increase</div></div><div class="chart-row"><div class="row-head"><span>Nine months</span><strong>50.7% from estimate changes</strong></div><div class="track share-track"><span class="fill gold" style="width:50.7%"></span></div><div class="row-detail">$37m change in adjustments / $73m operating-earnings increase</div></div><div class="axis"><span>0%</span><span>50%</span><span>100%</span></div></div><p class="chart-caption">The colored portion is the change in net estimate-at-completion adjustments. Each full track represents the operating-earnings increase for that period. It does not represent total earnings.</p><div class="chart-footer"><span>Source: Leonardo DRS public filings and earnings materials <sup class="refs"><a id="ref-source-1-6" href="#src-earnings-drs-2026-q3-1" aria-label="Source 1">1</a>,<a id="ref-source-2-3" href="#src-earnings-drs-2026-q3-2" aria-label="Source 2">2</a></sup><br>As of Oct. 29, 2026</span><strong>TGOs</strong></div></figure>
<p>Over nine months, contract-estimate adjustments moved from a net unfavorable amount to a net favorable amount. In Q3, both the current and prior-year periods already had net favorable adjustments. <sup class="refs"><a id="ref-source-2-4" href="#src-earnings-drs-2026-q3-2" aria-label="Source 2">2</a></sup> That difference explains why catch-up accounting accounts for about half of the nine-month operating-earnings gain but a smaller portion of the quarterly increase. <sup class="refs"><a id="ref-source-1-7" href="#src-earnings-drs-2026-q3-1" aria-label="Source 1">1</a>,<a id="ref-source-2-5" href="#src-earnings-drs-2026-q3-2" aria-label="Source 2">2</a></sup></p>
<p>DRS credits program execution, favorable mix and operating leverage for its Adjusted EBITDA improvement. <sup class="refs"><a id="ref-source-1-8" href="#src-earnings-drs-2026-q3-1" aria-label="Source 1">1</a></sup> The estimate-change comparison supports a narrower conclusion: Q3&#x27;s operating-profit growth was less dependent on catch-up adjustments than the nine-month result. It does not establish that all remaining growth will recur. <sup class="refs"><a id="ref-source-1-9" href="#src-earnings-drs-2026-q3-1" aria-label="Source 1">1</a>,<a id="ref-source-2-6" href="#src-earnings-drs-2026-q3-2" aria-label="Source 2">2</a></sup></p>
<h2 id="section-earnings-drs-2026-q3-3">The tax benefit also lifts adjusted EPS</h2>
<p>The increase in net earnings was larger than the operating gain.  Pretax earnings rose 33.3%, while net earnings rose 59.7%. <sup class="refs"><a id="ref-source-1-10" href="#src-earnings-drs-2026-q3-1" aria-label="Source 1">1</a></sup> The effective tax rate fell to 0.9%, from 17.2% a year earlier. <sup class="refs"><a id="ref-source-2-7" href="#src-earnings-drs-2026-q3-2" aria-label="Source 2">2</a></sup></p>
<p>DRS recognized an approximately $22 million tax benefit after the limitation period expired for a 2022 short-period return, allowing it to release unrecognized tax benefits.  It also purchased approximately $20 million of tax credits for approximately $18 million in cash. <sup class="refs"><a id="ref-source-2-8" href="#src-earnings-drs-2026-q3-2" aria-label="Source 2">2</a></sup></p>
<p>The discrete benefit remains in Adjusted Net Earnings and Adjusted Diluted EPS. <sup class="refs"><a id="ref-source-1-11" href="#src-earnings-drs-2026-q3-1" aria-label="Source 1">1</a>,<a id="ref-source-2-9" href="#src-earnings-drs-2026-q3-2" aria-label="Source 2">2</a></sup> The reconciliation excludes amortization of acquired intangibles, deal-related transaction costs, restructuring costs and other one-time non-operational events, together with their tax effects. It does not separately remove this tax benefit. <sup class="refs"><a id="ref-source-1-12" href="#src-earnings-drs-2026-q3-1" aria-label="Source 1">1</a>,<a id="ref-source-2-10" href="#src-earnings-drs-2026-q3-2" aria-label="Source 2">2</a></sup></p>
<p>The benefit equates to roughly $0.08 per diluted share, within reported Adjusted EPS of $0.46.  That calculation isolates the approximate per-share contribution of this benefit; it does not produce a fully normalized earnings measure. <sup class="refs"><a id="ref-source-1-13" href="#src-earnings-drs-2026-q3-1" aria-label="Source 1">1</a>,<a id="ref-source-2-11" href="#src-earnings-drs-2026-q3-2" aria-label="Source 2">2</a></sup></p>
<p>DRS itself credits both operating performance and a lower tax rate for earnings growth.  Its full-year tax assumption fell to 13.0% from 16.5%. <sup class="refs"><a id="ref-source-1-14" href="#src-earnings-drs-2026-q3-1" aria-label="Source 1">1</a></sup> July&#x27;s update had already reduced the assumption from 18.5%. <sup class="refs"><a id="ref-source-4-2" href="#src-earnings-drs-2026-q3-4" aria-label="Source 4">4</a></sup> The raised EPS outlook therefore includes a tax tailwind alongside operating improvement. <sup class="refs"><a id="ref-source-1-15" href="#src-earnings-drs-2026-q3-1" aria-label="Source 1">1</a></sup></p>
<h2 id="section-earnings-drs-2026-q3-4">IMS earns more operating profit on a smaller revenue base</h2>
<p>Advanced Sensing and Computing (ASC) remains the larger segment by revenue, but Integrated Mission Systems (IMS) produces more operating earnings.  IMS accounts for 52.9% of the two segments&#x27; combined operating earnings on 39.4% of their combined revenue, including intersegment sales. <sup class="refs"><a id="ref-source-1-16" href="#src-earnings-drs-2026-q3-1" aria-label="Source 1">1</a></sup></p>
<figure id="segment-economics" class="gfx"><figcaption><h2 id="section-earnings-drs-2026-q3-5">DRS&#x27;s smaller IMS segment earns more operating profit</h2><p class="chart-subtitle">Q3 2026, $ millions. ASC: Advanced Sensing and Computing. IMS: Integrated Mission Systems. Revenue includes intersegment sales. The panels use separate zero-based scales.</p></figcaption><div class="plot" role="img" aria-label="DRS&#x27;s smaller IMS segment earns more operating profit. Q3 2026, $ millions. ASC: Advanced Sensing and Computing. IMS: Integrated Mission Systems. Revenue includes intersegment sales. The panels use separate zero-based scales. Measure: Segment revenue, Comparison: ASC, Value ($m): 659; Measure: Segment revenue, Comparison: IMS, Value ($m): 428; Measure: GAAP operating earnings, Comparison: ASC, Value ($m): 57; Measure: GAAP operating earnings, Comparison: IMS, Value ($m): 64."><div class="panels"><section class="plot-panel"><h3>Segment revenue</h3><div class="chart-row"><div class="row-head"><span>ASC</span><strong>659</strong></div><div class="track"><span class="fill blue" style="width:94.14286%"></span></div></div><div class="chart-row"><div class="row-head"><span>IMS</span><strong>428</strong></div><div class="track"><span class="fill gold" style="width:61.14286%"></span></div></div><div class="axis"><span>0</span><span>700</span></div></section><section class="plot-panel"><h3>GAAP operating earnings</h3><div class="chart-row"><div class="row-head"><span>ASC</span><strong>57</strong></div><div class="track"><span class="fill blue" style="width:81.42857%"></span></div></div><div class="chart-row"><div class="row-head"><span>IMS</span><strong>64</strong></div><div class="track"><span class="fill gold" style="width:91.42857%"></span></div></div><div class="axis"><span>0</span><span>70</span></div></section></div></div><p class="chart-caption">Corporate &amp; Eliminations removed $21 million from segment revenue and recorded a $5 million operating loss. Segment totals therefore differ from consolidated results.</p><div class="chart-footer"><span>Source: Leonardo DRS public filings and earnings materials <sup class="refs"><a id="ref-source-1-17" href="#src-earnings-drs-2026-q3-1" aria-label="Source 1">1</a>,<a id="ref-source-2-12" href="#src-earnings-drs-2026-q3-2" aria-label="Source 2">2</a></sup><br>As of Oct. 29, 2026</span><strong>TGOs</strong></div></figure>
<p>IMS contributed $16 million of additional operating earnings, compared with $12 million at ASC. <sup class="refs"><a id="ref-source-1-18" href="#src-earnings-drs-2026-q3-1" aria-label="Source 1">1</a></sup> A $5 million deterioration in Corporate &amp; Eliminations offset part of those gains. <sup class="refs"><a id="ref-source-2-13" href="#src-earnings-drs-2026-q3-2" aria-label="Source 2">2</a></sup></p>
<p>The filing credits IMS&#x27;s operating improvement to land and naval programs and leverage from higher volume. <sup class="refs"><a id="ref-source-2-14" href="#src-earnings-drs-2026-q3-2" aria-label="Source 2">2</a></sup> The release credits volume leverage and execution in electric power and propulsion for the segment&#x27;s Adjusted EBITDA improvement, despite increased internal research spending. <sup class="refs"><a id="ref-source-1-19" href="#src-earnings-drs-2026-q3-1" aria-label="Source 1">1</a></sup></p>
<p>The prior-year comparison already included substantial growth: IMS&#x27;s Q3 2025 revenue had risen from $285 million to $383 million. <sup class="refs"><a id="ref-source-3-1" href="#src-earnings-drs-2026-q3-3" aria-label="Source 3">3</a></sup> In 2026, IMS&#x27;s Adjusted EBITDA margin improved from Q1 to Q2, then eased in Q3 while remaining above the prior-year quarter. <sup class="refs"><a id="ref-source-1-20" href="#src-earnings-drs-2026-q3-1" aria-label="Source 1">1</a>,<a id="ref-source-4-3" href="#src-earnings-drs-2026-q3-4" aria-label="Source 4">4</a>,<a id="ref-source-5-2" href="#src-earnings-drs-2026-q3-5" aria-label="Source 5">5</a></sup></p>
<div class="table-wrap" role="region" aria-label="IMS retains the higher margin; ASC holds its Q2 level" tabindex="0"><table><caption>IMS retains the higher margin; ASC holds its Q2 level</caption><thead><tr><th scope="col">Segment Adjusted EBITDA margin</th><th scope="col">Q3 2025</th><th scope="col">Q1 2026</th><th scope="col">Q2 2026</th><th scope="col">Q3 2026</th></tr></thead><tbody><tr><th scope="row">Advanced Sensing and Computing</th><td>11.0% <sup class="refs"><a id="ref-source-1-21" href="#src-earnings-drs-2026-q3-1" aria-label="Source 1">1</a></sup></td><td>11.1% <sup class="refs"><a id="ref-source-5-3" href="#src-earnings-drs-2026-q3-5" aria-label="Source 5">5</a></sup></td><td>11.8% <sup class="refs"><a id="ref-source-4-4" href="#src-earnings-drs-2026-q3-4" aria-label="Source 4">4</a></sup></td><td>11.8% <sup class="refs"><a id="ref-source-1-22" href="#src-earnings-drs-2026-q3-1" aria-label="Source 1">1</a></sup></td></tr><tr><th scope="row">Integrated Mission Systems</th><td>13.8% <sup class="refs"><a id="ref-source-1-23" href="#src-earnings-drs-2026-q3-1" aria-label="Source 1">1</a></sup></td><td>14.6% <sup class="refs"><a id="ref-source-5-4" href="#src-earnings-drs-2026-q3-5" aria-label="Source 5">5</a></sup></td><td>17.7% <sup class="refs"><a id="ref-source-4-5" href="#src-earnings-drs-2026-q3-4" aria-label="Source 4">4</a></sup></td><td>16.6% <sup class="refs"><a id="ref-source-1-24" href="#src-earnings-drs-2026-q3-1" aria-label="Source 1">1</a></sup></td></tr></tbody></table></div><p class="table-caption">Non-GAAP margins; each quarter is shown separately.</p>
<p>ASC&#x27;s GAAP operating margin also advanced through the year, reaching 8.6% in Q3 from 7.2% in Q1. <sup class="refs"><a id="ref-source-1-25" href="#src-earnings-drs-2026-q3-1" aria-label="Source 1">1</a>,<a id="ref-source-5-5" href="#src-earnings-drs-2026-q3-5" aria-label="Source 5">5</a></sup> DRS attributes ASC&#x27;s Q3 revenue growth primarily to tactical radars and space sensing programs. <sup class="refs"><a id="ref-source-1-26" href="#src-earnings-drs-2026-q3-1" aria-label="Source 1">1</a></sup></p>
<h2 id="section-earnings-drs-2026-q3-6">IMS growth comes with a different contract mix</h2>
<p>IMS&#x27;s flexibly priced revenue increased while its fixed-price revenue declined. <sup class="refs"><a id="ref-source-2-15" href="#src-earnings-drs-2026-q3-2" aria-label="Source 2">2</a></sup> Flexibly priced work, covering cost-plus and time-and-materials contracts, reached 19.6% of segment revenue, versus 6.3% a year earlier. <sup class="refs"><a id="ref-source-1-27" href="#src-earnings-drs-2026-q3-1" aria-label="Source 1">1</a>,<a id="ref-source-2-16" href="#src-earnings-drs-2026-q3-2" aria-label="Source 2">2</a></sup></p>
<figure id="ims-contract-mix" class="gfx"><figcaption><h2 id="section-earnings-drs-2026-q3-7">DRS&#x27;s IMS flexibly priced revenue rises as fixed-price revenue falls</h2><p class="chart-subtitle">Integrated Mission Systems revenue by contract type, Q3, $ millions. Both panels use the same zero-based scale. Contract-type amounts exclude intersegment sales.</p></figcaption><div class="plot" role="img" aria-label="DRS&#x27;s IMS flexibly priced revenue rises as fixed-price revenue falls. Integrated Mission Systems revenue by contract type, Q3, $ millions. Both panels use the same zero-based scale. Contract-type amounts exclude intersegment sales. Measure: Fixed-price, Comparison: 2025, Value ($m): 359; Measure: Fixed-price, Comparison: 2026, Value ($m): 343; Measure: Flexibly priced, Comparison: 2025, Value ($m): 24; Measure: Flexibly priced, Comparison: 2026, Value ($m): 84."><div class="panels"><section class="plot-panel"><h3>Fixed-price</h3><div class="chart-row"><div class="row-head"><span>2025</span><strong>359</strong></div><div class="track"><span class="fill muted" style="width:89.75000%"></span></div></div><div class="chart-row"><div class="row-head"><span>2026</span><strong>343</strong></div><div class="track"><span class="fill blue" style="width:85.75000%"></span></div></div><div class="axis"><span>0</span><span>400</span></div></section><section class="plot-panel"><h3>Flexibly priced</h3><div class="chart-row"><div class="row-head"><span>2025</span><strong>24</strong></div><div class="track"><span class="fill muted" style="width:6.00000%"></span></div></div><div class="chart-row"><div class="row-head"><span>2026</span><strong>84</strong></div><div class="track"><span class="fill gold" style="width:21.00000%"></span></div></div><div class="axis"><span>0</span><span>400</span></div></section></div></div><p class="chart-caption">Flexibly priced includes cost-plus and time-and-materials work. These figures do not identify the programs behind the shift or establish that it caused the margin increase.</p><div class="chart-footer"><span>Source: Leonardo DRS public filings and earnings materials <sup class="refs"><a id="ref-source-1-28" href="#src-earnings-drs-2026-q3-1" aria-label="Source 1">1</a>,<a id="ref-source-2-17" href="#src-earnings-drs-2026-q3-2" aria-label="Source 2">2</a></sup><br>As of Oct. 29, 2026</span><strong>TGOs</strong></div></figure>
<p>The customer-relationship mix also changed: IMS revenue as a subcontractor rose $73 million, while revenue as a prime contractor fell $29 million.  These disclosures identify the contracting relationship under which revenue was recognized; they do not assign the changes to individual programs. <sup class="refs"><a id="ref-source-2-18" href="#src-earnings-drs-2026-q3-2" aria-label="Source 2">2</a></sup></p>
<p>The mix shift coincided with a higher year-over-year IMS operating margin. <sup class="refs"><a id="ref-source-1-29" href="#src-earnings-drs-2026-q3-1" aria-label="Source 1">1</a>,<a id="ref-source-2-19" href="#src-earnings-drs-2026-q3-2" aria-label="Source 2">2</a></sup> The filing&#x27;s explanation credits program improvement and volume; it does not identify the contract-type change as the cause. <sup class="refs"><a id="ref-source-2-20" href="#src-earnings-drs-2026-q3-2" aria-label="Source 2">2</a></sup></p>
<h2 id="section-earnings-drs-2026-q3-8">Research spending rises unevenly across the business</h2>
<p>IMS increased company-funded independent research and development, or IR&amp;D, to $10 million from $7 million.  ASC&#x27;s spending declined, leaving the company-wide quarterly increase at just $1 million. <sup class="refs"><a id="ref-source-2-21" href="#src-earnings-drs-2026-q3-2" aria-label="Source 2">2</a></sup></p>
<p>That matters when reading the explanation for higher general and administrative expenses. The filing lists increased IR&amp;D, bid-and-proposal costs and expenses supporting the proposed Raft acquisition as drivers. <sup class="refs"><a id="ref-source-2-22" href="#src-earnings-drs-2026-q3-2" aria-label="Source 2">2</a></sup></p>
<p>The segment table shows G&amp;A excluding IR&amp;D rose $18 million, against a $19 million increase in total G&amp;A.  The disclosed figures therefore do not support assigning most of the quarterly expense increase to company-funded IR&amp;D. <sup class="refs"><a id="ref-source-1-30" href="#src-earnings-drs-2026-q3-1" aria-label="Source 1">1</a>,<a id="ref-source-2-23" href="#src-earnings-drs-2026-q3-2" aria-label="Source 2">2</a></sup></p>
<p>The presentation also describes a research-and-development step-up to 3.5% of sales, without defining the measure. <sup class="refs"><a id="ref-source-8-2" href="#src-earnings-drs-2026-q3-8" aria-label="Source 8">8</a></sup> Company-funded IR&amp;D already represented 3.5% of 2025 revenue and reached 3.7% in the first nine months of 2026. <sup class="refs"><a id="ref-source-1-31" href="#src-earnings-drs-2026-q3-1" aria-label="Source 1">1</a>,<a id="ref-source-2-24" href="#src-earnings-drs-2026-q3-2" aria-label="Source 2">2</a>,<a id="ref-source-6-1" href="#src-earnings-drs-2026-q3-6" aria-label="Source 6">6</a>,<a id="ref-source-7-1" href="#src-earnings-drs-2026-q3-7" aria-label="Source 7">7</a></sup></p>
<p>Company-funded IR&amp;D rose 40.2% in 2025. <sup class="refs"><a id="ref-source-7-2" href="#src-earnings-drs-2026-q3-7" aria-label="Source 7">7</a></sup> Its share of revenue increased from 2.8% in 2024 to 3.5% in 2025. <sup class="refs"><a id="ref-source-6-2" href="#src-earnings-drs-2026-q3-6" aria-label="Source 6">6</a>,<a id="ref-source-7-3" href="#src-earnings-drs-2026-q3-7" aria-label="Source 7">7</a></sup> Without a matching definition, the presentation&#x27;s target does not establish another full-year increase on the same basis. <sup class="refs"><a id="ref-source-6-3" href="#src-earnings-drs-2026-q3-6" aria-label="Source 6">6</a>,<a id="ref-source-7-4" href="#src-earnings-drs-2026-q3-7" aria-label="Source 7">7</a>,<a id="ref-source-8-3" href="#src-earnings-drs-2026-q3-8" aria-label="Source 8">8</a></sup></p>
<p>Capital spending was 3.4% of revenue through September, below the presentation&#x27;s full-year target of 4%. <sup class="refs"><a id="ref-source-1-32" href="#src-earnings-drs-2026-q3-1" aria-label="Source 1">1</a>,<a id="ref-source-8-4" href="#src-earnings-drs-2026-q3-8" aria-label="Source 8">8</a></sup> Quarterly capital expenditures nevertheless increased to $38 million from $30 million. <sup class="refs"><a id="ref-source-1-33" href="#src-earnings-drs-2026-q3-1" aria-label="Source 1">1</a></sup></p>
<h2 id="section-earnings-drs-2026-q3-9">Funded backlog grows faster than the total order book</h2>
<p>Q3 bookings increased 25.4%. <sup class="refs"><a id="ref-source-1-34" href="#src-earnings-drs-2026-q3-1" aria-label="Source 1">1</a></sup> Book-to-bill reached 1.5 times, following 1.2 times in Q2. <sup class="refs"><a id="ref-source-1-35" href="#src-earnings-drs-2026-q3-1" aria-label="Source 1">1</a>,<a id="ref-source-4-6" href="#src-earnings-drs-2026-q3-4" aria-label="Source 4">4</a></sup> DRS defines bookings on a funded basis: U.S. government awards require appropriated funds legally obligated to the company; other awards enter at their funded value. <sup class="refs"><a id="ref-source-2-25" href="#src-earnings-drs-2026-q3-2" aria-label="Source 2">2</a></sup></p>
<p>Funded backlog rose faster than total backlog while unfunded backlog declined.  The funded portion therefore gives a stronger growth signal than the total order book, although the disclosed balances do not quantify transfers between funded and unfunded backlog. <sup class="refs"><a id="ref-source-1-36" href="#src-earnings-drs-2026-q3-1" aria-label="Source 1">1</a>,<a id="ref-source-2-26" href="#src-earnings-drs-2026-q3-2" aria-label="Source 2">2</a></sup></p>
<figure id="funded-backlog" class="gfx"><figcaption><h2 id="section-earnings-drs-2026-q3-10">DRS&#x27;s backlog contains a larger funded share</h2><p class="chart-subtitle">Backlog at Sept. 30, $ millions. Funded and unfunded portions share one dollar scale.</p></figcaption><div class="plot" role="img" aria-label="DRS&#x27;s backlog contains a larger funded share. Backlog at Sept. 30, $ millions. Funded and unfunded portions share one dollar scale. Sept. 30: 2025, Funded ($m): 4,678, Unfunded ($m): 3,991, Total ($m): 8,669, Funded share: 54.0%; Sept. 30: 2026, Funded ($m): 5,640, Unfunded ($m): 3,741, Total ($m): 9,381, Funded share: 60.1%."><div class="chart-row"><div class="row-head"><span>2025</span><strong>8,669 total · 54.0% funded</strong></div><div class="track stack-track"><span class="fill blue" style="width:46.78000%"></span><span class="fill muted" style="width:39.91000%"></span></div><div class="stack-labels"><span><i class="swatch blue"></i>Funded 4,678</span><span><i class="swatch muted"></i>Unfunded 3,991</span></div></div><div class="chart-row"><div class="row-head"><span>2026</span><strong>9,381 total · 60.1% funded</strong></div><div class="track stack-track"><span class="fill blue" style="width:56.40000%"></span><span class="fill muted" style="width:37.41000%"></span></div><div class="stack-labels"><span><i class="swatch blue"></i>Funded 5,640</span><span><i class="swatch muted"></i>Unfunded 3,741</span></div></div><div class="axis"><span>0</span><span>10,000</span></div></div><p class="chart-caption">Both portions belong to backlog. Funded backlog is distinct from revenue already recognized or cash already collected.</p><div class="chart-footer"><span>Source: Leonardo DRS public filings and earnings materials <sup class="refs"><a id="ref-source-2-27" href="#src-earnings-drs-2026-q3-2" aria-label="Source 2">2</a></sup><br>As of Oct. 29, 2026</span><strong>TGOs</strong></div></figure>
<p>The distinction also has a timing dimension. DRS expects to recognize approximately 40% of remaining performance obligations as revenue within the next twelve months from September&#x27;s close. <sup class="refs"><a id="ref-source-2-28" href="#src-earnings-drs-2026-q3-2" aria-label="Source 2">2</a></sup> Approximately 40% relates to U.S. Navy electric power and propulsion contracts expected to convert over as long as eleven years. <sup class="refs"><a id="ref-source-2-29" href="#src-earnings-drs-2026-q3-2" aria-label="Source 2">2</a></sup></p>
<p>The release credits naval network computing and tactical radars for ASC&#x27;s quarterly bookings. <sup class="refs"><a id="ref-source-1-37" href="#src-earnings-drs-2026-q3-1" aria-label="Source 1">1</a></sup> The filing attributes ASC&#x27;s year-over-year bookings increase to tactical radars and aircraft protection systems, partly offset by fewer infrared sensing awards. <sup class="refs"><a id="ref-source-2-30" href="#src-earnings-drs-2026-q3-2" aria-label="Source 2">2</a></sup></p>
<p>For IMS, the release describes bookings balanced across electric power and propulsion and force protection. <sup class="refs"><a id="ref-source-1-38" href="#src-earnings-drs-2026-q3-1" aria-label="Source 1">1</a></sup> The filing identifies funding for naval power and propulsion as the principal source of the year-over-year bookings increase. <sup class="refs"><a id="ref-source-2-31" href="#src-earnings-drs-2026-q3-2" aria-label="Source 2">2</a></sup></p>
<p>The presentation describes a $500 million award supporting the Department of War&#x27;s counter-drone office, but does not identify its funding basis or contribution to bookings.  It also reports selection to provide the permanent-magnet electric propulsion system for the Republic of Korea Navy&#x27;s KDDX destroyer program. <sup class="refs"><a id="ref-source-8-5" href="#src-earnings-drs-2026-q3-8" aria-label="Source 8">8</a></sup></p>
<p>These opportunities sit within a business whose U.S. Navy and Army customers represented 37% and 34% of nine-month revenue, respectively, directly or indirectly. <sup class="refs"><a id="ref-source-2-32" href="#src-earnings-drs-2026-q3-2" aria-label="Source 2">2</a></sup> International revenue reached approximately 11% of nine-month revenue, versus 9% a year earlier. DRS partly attributes that increase to tactical radars used in counter-drone and short-range air defense applications. <sup class="refs"><a id="ref-source-2-33" href="#src-earnings-drs-2026-q3-2" aria-label="Source 2">2</a></sup></p>
<h2 id="section-earnings-drs-2026-q3-11">Cash improves over nine months but trails the quarterly earnings gain</h2>
<p>Q3 operating cash flow fell to $96 million from $107 million.  DRS attributes the decline in operating and free cash flow to more cash used for working capital, partly offset by higher earnings. <sup class="refs"><a id="ref-source-1-39" href="#src-earnings-drs-2026-q3-1" aria-label="Source 1">1</a></sup></p>
<p>Contract assets, or unbilled receivables, increased $152 million from year-end, while accounts payable fell $94 million.  The increase in unbilled receivables shows that some recognized revenue was still awaiting billing. <sup class="refs"><a id="ref-source-1-40" href="#src-earnings-drs-2026-q3-1" aria-label="Source 1">1</a></sup></p>
<p>The nine-month comparison is better: operating cash flow turned positive, and free cash flow improved by $121 million.  Even so, nine-month free cash flow was -$28 million. <sup class="refs"><a id="ref-source-1-41" href="#src-earnings-drs-2026-q3-1" aria-label="Source 1">1</a></sup></p>
<figure id="cash-rhythm" class="gfx"><figcaption><h2 id="section-earnings-drs-2026-q3-12">DRS&#x27;s prior year relied on a large Q4 cash inflow</h2><p class="chart-subtitle">Reported free cash flow, non-GAAP, $ millions. Consecutive quarters from Q3 2025 through Q3 2026; actuals only.</p></figcaption><div class="plot" role="img" aria-label="DRS&#x27;s prior year relied on a large Q4 cash inflow. Reported free cash flow, non-GAAP, $ millions. Consecutive quarters from Q3 2025 through Q3 2026; actuals only. Quarter: Q3 2025, Free cash flow ($m): 77; Quarter: Q4 2025, Free cash flow ($m): 376; Quarter: Q1 2026, Free cash flow ($m): -95; Quarter: Q2 2026, Free cash flow ($m): 6; Quarter: Q3 2026, Free cash flow ($m): 61."><div class="chart-row"><div class="row-head"><span>Q3 2025</span><strong>77</strong></div><div class="track diverge-track"><span class="zero" style="left:20.00000%"></span><span class="fill blue" style="left:20.00000%;width:15.40000%"></span></div></div><div class="chart-row"><div class="row-head"><span>Q4 2025</span><strong>376</strong></div><div class="track diverge-track"><span class="zero" style="left:20.00000%"></span><span class="fill gold" style="left:20.00000%;width:75.20000%"></span></div></div><div class="chart-row"><div class="row-head"><span>Q1 2026</span><strong>-95</strong></div><div class="track diverge-track"><span class="zero" style="left:20.00000%"></span><span class="fill negative" style="left:1.00000%;width:19.00000%"></span></div></div><div class="chart-row"><div class="row-head"><span>Q2 2026</span><strong>6</strong></div><div class="track diverge-track"><span class="zero" style="left:20.00000%"></span><span class="fill blue" style="left:20.00000%;width:1.20000%"></span></div></div><div class="chart-row"><div class="row-head"><span>Q3 2026</span><strong>61</strong></div><div class="track diverge-track"><span class="zero" style="left:20.00000%"></span><span class="fill blue" style="left:20.00000%;width:12.20000%"></span></div></div><div class="diverge-axis"><span style="left:0">-100</span><span style="left:20.00000%">0</span><span style="right:0">400</span></div></div><p class="chart-caption">Free cash flow is operating cash flow plus transaction-related expenditures net of tax, less capital expenditures, plus asset-sale proceeds. The prior Q4 inflow does not establish the amount DRS will generate in Q4 2026.</p><div class="chart-footer"><span>Source: Leonardo DRS public filings and earnings materials <sup class="refs"><a id="ref-source-1-42" href="#src-earnings-drs-2026-q3-1" aria-label="Source 1">1</a>,<a id="ref-source-4-7" href="#src-earnings-drs-2026-q3-4" aria-label="Source 4">4</a>,<a id="ref-source-5-6" href="#src-earnings-drs-2026-q3-5" aria-label="Source 5">5</a>,<a id="ref-source-6-4" href="#src-earnings-drs-2026-q3-6" aria-label="Source 6">6</a></sup><br>As of Oct. 29, 2026</span><strong>TGOs</strong></div></figure>
<p>In 2025, a negative nine-month free cash flow balance became a positive $227 million full-year result after the fourth quarter.  That precedent shows the importance of fourth-quarter cash generation, without establishing that the same inflow will repeat. <sup class="refs"><a id="ref-source-1-43" href="#src-earnings-drs-2026-q3-1" aria-label="Source 1">1</a>,<a id="ref-source-6-5" href="#src-earnings-drs-2026-q3-6" aria-label="Source 6">6</a></sup></p>
<p>For 2026, DRS targets approximately 75% free cash flow conversion of Adjusted Net Earnings and expects Q4 to contribute materially to the full-year result. <sup class="refs"><a id="ref-source-8-6" href="#src-earnings-drs-2026-q3-8" aria-label="Source 8">8</a></sup> With free cash flow still negative through September, achieving that target depends on a substantial fourth-quarter inflow. <sup class="refs"><a id="ref-source-1-44" href="#src-earnings-drs-2026-q3-1" aria-label="Source 1">1</a>,<a id="ref-source-8-7" href="#src-earnings-drs-2026-q3-8" aria-label="Source 8">8</a></sup></p>
<h2 id="section-earnings-drs-2026-q3-13">Raft adds a pending cash commitment</h2>
<p>Cash fell by $353 million from year-end to $294 million. <sup class="refs"><a id="ref-source-1-45" href="#src-earnings-drs-2026-q3-1" aria-label="Source 1">1</a></sup> January&#x27;s repayment of the remaining $191 million term loan was a substantial use of cash. <sup class="refs"><a id="ref-source-2-34" href="#src-earnings-drs-2026-q3-2" aria-label="Source 2">2</a></sup></p>
<p>DRS also returned approximately $24 million in Q3 dividends and spent approximately $12 million on share repurchases. <sup class="refs"><a id="ref-source-1-46" href="#src-earnings-drs-2026-q3-1" aria-label="Source 1">1</a></sup> About $62 million had been used under its $75 million repurchase authorization through September. <sup class="refs"><a id="ref-source-2-35" href="#src-earnings-drs-2026-q3-2" aria-label="Source 2">2</a></sup></p>
<p>The pending all-cash acquisition of mission-software and AI data-fusion company Raft, valued at $450 million, would add another claim on liquidity. <sup class="refs"><a id="ref-source-9-1" href="#src-earnings-drs-2026-q3-9" aria-label="Source 9">9</a></sup> DRS expects the transaction to close in Q4, subject to closing conditions and regulatory approvals, using cash and revolving-credit borrowings. <sup class="refs"><a id="ref-source-2-36" href="#src-earnings-drs-2026-q3-2" aria-label="Source 2">2</a>,<a id="ref-source-8-8" href="#src-earnings-drs-2026-q3-8" aria-label="Source 8">8</a></sup></p>
<p>The announced transaction value exceeds September&#x27;s cash balance by roughly $156 million, before any fourth-quarter cash generation. <sup class="refs"><a id="ref-source-1-47" href="#src-earnings-drs-2026-q3-1" aria-label="Source 1">1</a>,<a id="ref-source-9-2" href="#src-earnings-drs-2026-q3-9" aria-label="Source 9">9</a></sup> The $500 million revolver had no outstanding borrowing balance at quarter-end and expires in January 2031. <sup class="refs"><a id="ref-source-2-37" href="#src-earnings-drs-2026-q3-2" aria-label="Source 2">2</a></sup></p>
<p>DRS forecasts a deal-related tax benefit over fifteen years with a present value of approximately $50 million.  It expects Adjusted EPS accretion in the first full year of ownership. <sup class="refs"><a id="ref-source-9-3" href="#src-earnings-drs-2026-q3-9" aria-label="Source 9">9</a></sup> The current earnings guidance excludes Raft. <sup class="refs"><a id="ref-source-1-48" href="#src-earnings-drs-2026-q3-1" aria-label="Source 1">1</a></sup></p>
<h2 id="section-earnings-drs-2026-q3-14">The raised outlook still requires a large fourth quarter</h2>
<p>October&#x27;s update raises revenue and profit expectations, following July&#x27;s profit increase with unchanged revenue guidance. <sup class="refs"><a id="ref-source-1-49" href="#src-earnings-drs-2026-q3-1" aria-label="Source 1">1</a>,<a id="ref-source-4-8" href="#src-earnings-drs-2026-q3-4" aria-label="Source 4">4</a></sup> DRS now forecasts organic revenue growth of 8% to 9% for 2026. <sup class="refs"><a id="ref-source-8-9" href="#src-earnings-drs-2026-q3-8" aria-label="Source 8">8</a></sup></p>
<figure id="guidance" class="gfx"><figcaption><h2 id="section-earnings-drs-2026-q3-15">DRS&#x27;s profit outlook climbs through 2026</h2><p class="chart-subtitle">Full-year 2026 company guidance, $ millions. Adjusted EBITDA is non-GAAP. Separate, truncated axes show forecast intervals.</p></figcaption><div class="plot" role="img" aria-label="DRS&#x27;s profit outlook climbs through 2026. Full-year 2026 company guidance, $ millions. Adjusted EBITDA is non-GAAP. Separate, truncated axes show forecast intervals. Measure: Revenue, 2026 update: Feb. 24, Forecast low ($m): 3,850, Forecast high ($m): 3,950; Measure: Revenue, 2026 update: May 5, Forecast low ($m): 3,900, Forecast high ($m): 3,975; Measure: Revenue, 2026 update: July 30, Forecast low ($m): 3,900, Forecast high ($m): 3,975; Measure: Revenue, 2026 update: Oct. 29, Forecast low ($m): 3,950, Forecast high ($m): 3,985; Measure: Adjusted EBITDA, 2026 update: Feb. 24, Forecast low ($m): 505, Forecast high ($m): 525; Measure: Adjusted EBITDA, 2026 update: May 5, Forecast low ($m): 515, Forecast high ($m): 530; Measure: Adjusted EBITDA, 2026 update: July 30, Forecast low ($m): 525, Forecast high ($m): 540; Measure: Adjusted EBITDA, 2026 update: Oct. 29, Forecast low ($m): 545, Forecast high ($m): 555."><div class="panels"><section class="plot-panel"><h3>Revenue</h3><div class="chart-row"><div class="row-head"><span>Feb. 24</span><strong>3,850–3,950</strong></div><div class="track range-track"><span class="forecast" style="left:25.00000%;width:50.00000%"></span></div></div><div class="chart-row"><div class="row-head"><span>May 5</span><strong>3,900–3,975</strong></div><div class="track range-track"><span class="forecast" style="left:50.00000%;width:37.50000%"></span></div></div><div class="chart-row"><div class="row-head"><span>July 30</span><strong>3,900–3,975</strong></div><div class="track range-track"><span class="forecast" style="left:50.00000%;width:37.50000%"></span></div></div><div class="chart-row"><div class="row-head"><span>Oct. 29</span><strong>3,950–3,985</strong></div><div class="track range-track"><span class="forecast" style="left:75.00000%;width:17.50000%"></span></div></div><div class="axis"><span>3,800</span><span>4,000</span></div></section><section class="plot-panel"><h3>Adjusted EBITDA</h3><div class="chart-row"><div class="row-head"><span>Feb. 24</span><strong>505–525</strong></div><div class="track range-track"><span class="forecast" style="left:8.33333%;width:33.33333%"></span></div></div><div class="chart-row"><div class="row-head"><span>May 5</span><strong>515–530</strong></div><div class="track range-track"><span class="forecast" style="left:25.00000%;width:25.00000%"></span></div></div><div class="chart-row"><div class="row-head"><span>July 30</span><strong>525–540</strong></div><div class="track range-track"><span class="forecast" style="left:41.66667%;width:25.00000%"></span></div></div><div class="chart-row"><div class="row-head"><span>Oct. 29</span><strong>545–555</strong></div><div class="track range-track"><span class="forecast" style="left:75.00000%;width:16.66667%"></span></div></div><div class="axis"><span>500</span><span>560</span></div></section></div></div><p class="chart-caption">Hatched intervals are forecasts. October guidance excludes the pending Raft acquisition.</p><div class="chart-footer"><span>Source: Leonardo DRS public filings and earnings materials <sup class="refs"><a id="ref-source-1-50" href="#src-earnings-drs-2026-q3-1" aria-label="Source 1">1</a>,<a id="ref-source-4-9" href="#src-earnings-drs-2026-q3-4" aria-label="Source 4">4</a>,<a id="ref-source-5-7" href="#src-earnings-drs-2026-q3-5" aria-label="Source 5">5</a>,<a id="ref-source-6-6" href="#src-earnings-drs-2026-q3-6" aria-label="Source 6">6</a></sup><br>As of Oct. 29, 2026</span><strong>TGOs</strong></div></figure>
<p>President and CEO John Baylouny linked the raised outlook to funded backlog and better fourth-quarter visibility in the Oct. 29 earnings release. <sup class="refs"><a id="ref-source-1-51" href="#src-earnings-drs-2026-q3-1" aria-label="Source 1">1</a></sup> The presentation identifies material receipts and labor execution as the primary factors influencing revenue. <sup class="refs"><a id="ref-source-8-10" href="#src-earnings-drs-2026-q3-8" aria-label="Source 8">8</a></sup></p>
<p>Adjusted Diluted EPS guidance increased to $1.50–$1.53.  Its improvement reflects an outlook that combines higher Adjusted EBITDA with a lower assumed tax rate. <sup class="refs"><a id="ref-source-1-52" href="#src-earnings-drs-2026-q3-1" aria-label="Source 1">1</a></sup></p>
<p>Subtracting nine-month results from rounded full-year guidance gives the approximate fourth-quarter requirements below. These are implied amounts; DRS has not provided a separate Q4 forecast in these materials. <sup class="refs"><a id="ref-source-1-53" href="#src-earnings-drs-2026-q3-1" aria-label="Source 1">1</a></sup></p>
<div class="table-wrap" role="region" aria-label="What the October outlook implies for Q4" tabindex="0"><table><caption>What the October outlook implies for Q4</caption><thead><tr><th scope="col">Measure</th><th scope="col">Nine months 2026 actual</th><th scope="col">Full-year 2026 guidance</th><th scope="col">Approximate implied Q4 2026</th></tr></thead><tbody><tr><th scope="row">Revenue ($ millions)</th><td>2,825 <sup class="refs"><a id="ref-source-1-54" href="#src-earnings-drs-2026-q3-1" aria-label="Source 1">1</a></sup></td><td>3,950–3,985 <sup class="refs"><a id="ref-source-1-55" href="#src-earnings-drs-2026-q3-1" aria-label="Source 1">1</a></sup></td><td>1,125–1,160 <sup class="refs"><a id="ref-source-1-56" href="#src-earnings-drs-2026-q3-1" aria-label="Source 1">1</a></sup></td></tr><tr><th scope="row">Adjusted EBITDA ($ millions; non-GAAP)</th><td>382 <sup class="refs"><a id="ref-source-1-57" href="#src-earnings-drs-2026-q3-1" aria-label="Source 1">1</a></sup></td><td>545–555 <sup class="refs"><a id="ref-source-1-58" href="#src-earnings-drs-2026-q3-1" aria-label="Source 1">1</a></sup></td><td>163–173 <sup class="refs"><a id="ref-source-1-59" href="#src-earnings-drs-2026-q3-1" aria-label="Source 1">1</a></sup></td></tr><tr><th scope="row">Adjusted diluted EPS ($; non-GAAP)</th><td>1.07 <sup class="refs"><a id="ref-source-1-60" href="#src-earnings-drs-2026-q3-1" aria-label="Source 1">1</a></sup></td><td>1.50–1.53 <sup class="refs"><a id="ref-source-1-61" href="#src-earnings-drs-2026-q3-1" aria-label="Source 1">1</a></sup></td><td>0.43–0.46 <sup class="refs"><a id="ref-source-1-62" href="#src-earnings-drs-2026-q3-1" aria-label="Source 1">1</a></sup></td></tr></tbody></table></div><p class="table-caption">Implied values equal full-year guidance less nine-month results. EPS subtraction is approximate because reported per-share amounts are rounded and share counts differ by period. <sup class="refs"><a id="ref-source-1-63" href="#src-earnings-drs-2026-q3-1" aria-label="Source 1">1</a></sup></p>
<p>The remaining execution risk extends beyond DRS&#x27;s factories. Its filing describes temporary Department of War funding through Dec. 11, 2026, with restrictions on new starts and production-rate increases that may affect award timing.  Proposed FY2027 increases still require congressional approval and do not represent enacted funding or committed orders for DRS. <sup class="refs"><a id="ref-source-2-38" href="#src-earnings-drs-2026-q3-2" aria-label="Source 2">2</a></sup></p>
<p class="scope">Coverage: Leonardo DRS earnings releases, SEC filings and the official earnings presentation. This Assessment does not include a review of call audio or analyst Q&amp;A. Quarter comparisons use Q3 2026 and Q3 2025; nine-month comparisons use the corresponding periods through September. Earlier quarters are identified separately.</p></article><section class="sources" aria-labelledby="sources-title"></section><footer class="footer">TGOs · Where the money’s going, who’s buying whom, and what it means for the mission.</footer><details class="srcs" open><summary>Sources (9)</summary><ol><li id="src-earnings-drs-2026-q3-1"><a href="https://www.sec.gov/Archives/edgar/data/1833756/000183375626000042/q32026earningspressrelease.htm" rel=noopener>Leonardo DRS, Q3 2026 earnings release</a></li><li id="src-earnings-drs-2026-q3-2"><a href="https://www.sec.gov/Archives/edgar/data/1833756/000183375626000044/drs-20260930.htm" rel=noopener>Leonardo DRS, Q3 2026 Form 10-Q</a></li><li id="src-earnings-drs-2026-q3-3"><a href="https://www.sec.gov/Archives/edgar/data/1833756/000183375625000007/q32025earningspressrelease.htm" rel=noopener>Leonardo DRS, Q3 2025 earnings release</a></li><li id="src-earnings-drs-2026-q3-4"><a href="https://www.sec.gov/Archives/edgar/data/1833756/000183375626000037/q22026earningspressrelease.htm" rel=noopener>Leonardo DRS, Q2 2026 earnings release</a></li><li id="src-earnings-drs-2026-q3-5"><a href="https://www.sec.gov/Archives/edgar/data/1833756/000183375626000023/q12026earningspressrelease.htm" rel=noopener>Leonardo DRS, Q1 2026 earnings release</a></li><li id="src-earnings-drs-2026-q3-6"><a href="https://www.sec.gov/Archives/edgar/data/1833756/000183375626000009/q42025earningspressrelease.htm" rel=noopener>Leonardo DRS, Q4 and full-year 2025 earnings release</a></li><li id="src-earnings-drs-2026-q3-7"><a href="https://www.sec.gov/Archives/edgar/data/1833756/000183375626000013/drs-20251231.htm" rel=noopener>Leonardo DRS, 2025 Form 10-K</a></li><li id="src-earnings-drs-2026-q3-8"><a href="https://investors.leonardodrs.com/static-files/59fa6b9d-a551-446e-9f6f-01f80cc60564" rel=noopener>Leonardo DRS, Q3 2026 earnings presentation</a></li><li id="src-earnings-drs-2026-q3-9"><a href="https://www.sec.gov/Archives/edgar/data/1833756/000183375626000034/exhibit991-raftacquisition.htm" rel=noopener>Leonardo DRS, Raft acquisition announcement</a></li></ol></details><section class="chart-downloads"><h2>Take the chart with you</h2><ul><li><a href="/earnings/drs-2026-q3/analysis/share.png" download>Share chart</a></li></ul></section></article><section class="connected-reporting"><h2>Follow the reporting</h2><ul class="cards"><li class="card"><a href="/news/2026/10/29/leonardo-drs-bookings-reach-1-5-times-quarterly-revenue/"><span class="k">Brief</span><b>Leonardo DRS bookings reach 1.5 times quarterly revenue</b><span class="d">Leonardo DRS raised its 2026 outlook with record funded backlog, while quarterly free cash flow fell from a year earlier.</span><time datetime="2026-10-29">Oct 29, 2026</time></a></li></ul><p><a href="/earnings/drs-2026-q3/">Leonardo DRS · Q3 2026: earnings and company materials ↗</a></p><p><a href="/earnings/drs-2026-q2/">Leonardo DRS · Q2 2026: earnings and company materials ↗</a></p></section>