# General Dynamics directs most capital spending to Marine Systems

Canonical: https://tgos.io/earnings/gd-2026-q3/analysis/

<article class="assess ax-earnings-gd-2026-q3"><p class="kicker">Earnings analysis</p><h1>General Dynamics directs most capital spending to Marine Systems</h1><p class="dek">Submarine orders expand future work, largely through unfunded backlog. Higher investment and lower operating cash reduce quarterly free cash flow despite stronger earnings.</p><p class="byline"><time datetime="2026-11-01">November 1, 2026</time></p><details class="assessment-contents"><summary>In this analysis</summary><nav aria-label="In this analysis"><ol><li><a href="#section-earnings-gd-2026-q3-1">Quarterly cash generation weakens despite higher earnings</a></li><li><a href="#section-earnings-gd-2026-q3-2">GD’s five named working-capital lines improve in aggregate</a></li><li><a href="#section-earnings-gd-2026-q3-3">Marine takes most of the added capital spending</a></li><li><a href="#section-earnings-gd-2026-q3-4">Dividends, buybacks and note repayments nearly match Q3 free cash flow</a></li><li><a href="#section-earnings-gd-2026-q3-5">Growth extends beyond Marine Systems</a></li><li><a href="#section-earnings-gd-2026-q3-6">Marine’s backlog expands mainly through unfunded work</a></li><li><a href="#section-earnings-gd-2026-q3-7">GD raises annual revenue and EPS targets</a></li></ol></nav></details><header><p class="scope">Release, filing and presentation analysis · Q3 2026, ended October 4, 2026</p></header><article><p><span data-evidence="q_segcapex_q3_marine c_marine_share_q3_capex">General Dynamics directed most of its third-quarter capital spending to Marine Systems, where investment reached $303 million.</span> <span data-evidence="c_marine_share_q3_capex_increase">The shipbuilding segment accounted for 77.0% of the company’s year-over-year increase in capital spending.</span><sup class="refs"><a id="ref-1-1" href="#src-earnings-gd-2026-q3-1" aria-label="Source 1">1</a></sup></p>
<p><span data-evidence="q_segcapex_q3_marine q_defense_backlog q_bl_q3_marine q_bl_q2_marine">The spending puts current cash demands alongside a much larger book of future submarine work, with most of Marine’s quarterly backlog increase coming from unfunded work.</span> <span data-evidence="q_backlog_defs">GD believes that unfunded work is likely to be funded, but future appropriations are not guaranteed.</span> <span data-evidence="q_env_navy q_segcapex_q3_marine">The investment establishes spending today; the disclosures do not quantify when it will produce additional delivered capacity.</span><sup class="refs"><a id="ref-1-2" href="#src-earnings-gd-2026-q3-1" aria-label="Source 1">1</a></sup></p>
<p><span data-evidence="">This assessment covers earnings releases, filings and presentations, including prior periods. The webcast and analyst Q&amp;A were not reviewed.</span></p>
<h2 data-evidence="rel_ocf rel_fcf rel_netearn" id="section-earnings-gd-2026-q3-1">Quarterly cash generation weakens despite higher earnings</h2>
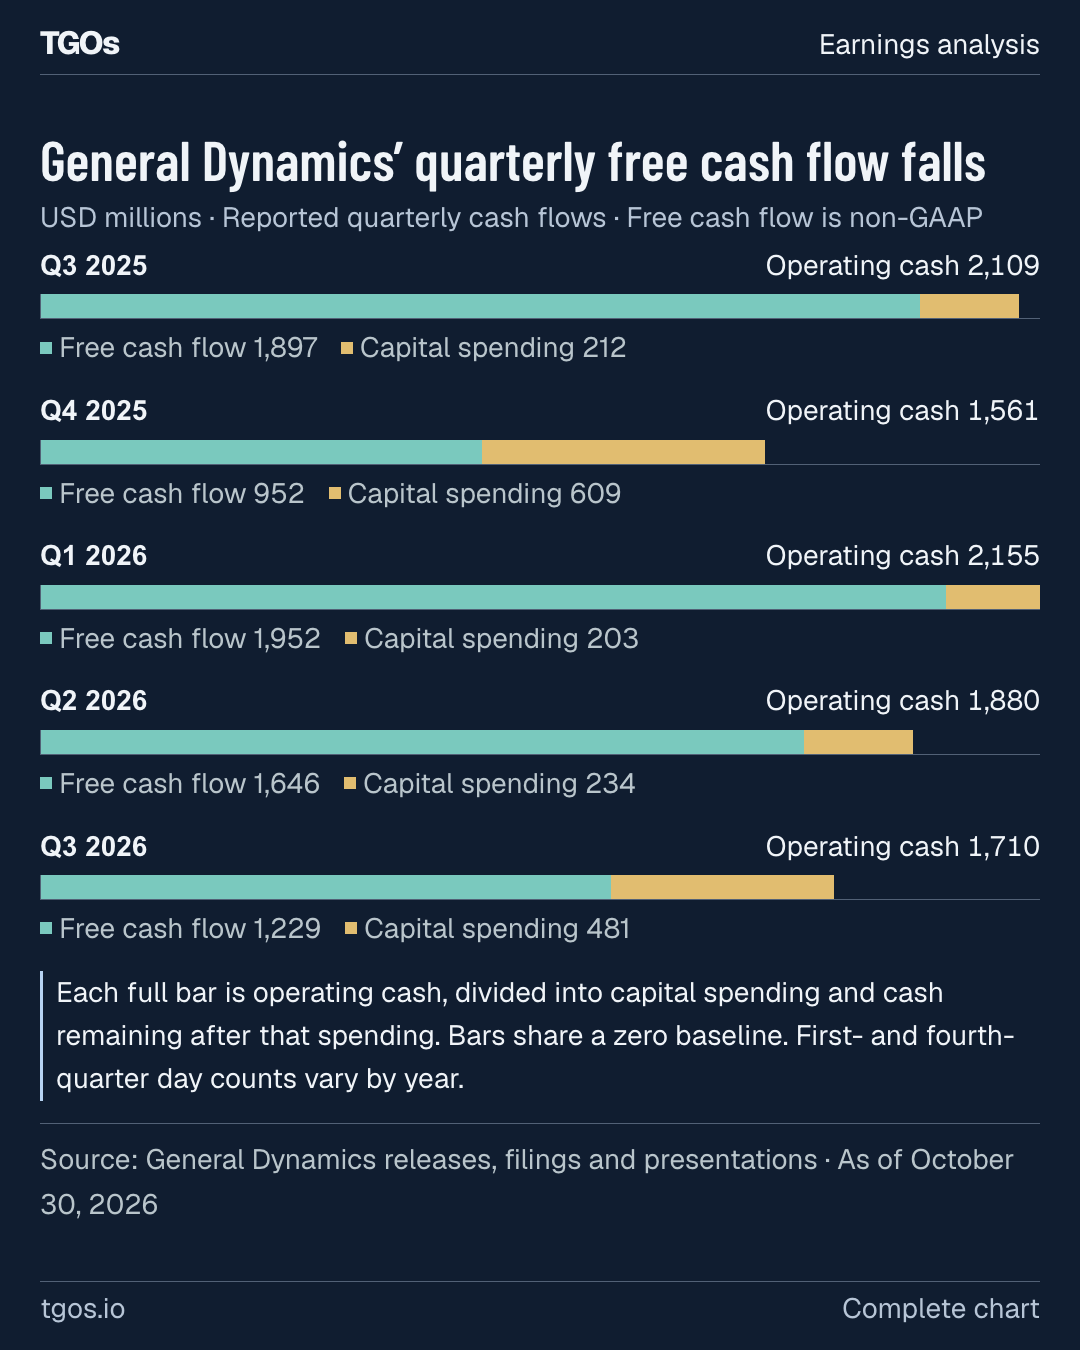
<p><span data-evidence="c_q3_fcf_growth rel_fcf rel_netearn">Third-quarter free cash flow fell 35.2% to $1.229 billion, despite higher net earnings.</span> <span data-evidence="rel_fcf_def">GD defines free cash flow, a non-GAAP measure, as operating cash less capital expenditures.</span><sup class="refs"><a id="ref-2-1" href="#src-earnings-gd-2026-q3-2" aria-label="Source 2">2</a></sup></p>
<p><span data-evidence="c_q3_ocf_growth c_q3_capex_growth">Operating cash declined 18.9% year over year, and capital expenditures rose 126.9%.</span><sup class="refs"><a id="ref-2-2" href="#src-earnings-gd-2026-q3-2" aria-label="Source 2">2</a></sup> <span data-evidence="q1r_ocf q2r_ocf rel_ocf">Operating cash also fell from the preceding quarter, extending the decline from the first quarter.</span><sup class="refs"><a id="ref-2-3" href="#src-earnings-gd-2026-q3-2" aria-label="Source 2">2</a>, <a id="ref-3-1" href="#src-earnings-gd-2026-q3-3" aria-label="Source 3">3</a>, <a id="ref-4-1" href="#src-earnings-gd-2026-q3-4" aria-label="Source 4">4</a></sup></p>
<figure id="quarterly-cash" class="gfx" data-evidence="rel_fcf_def q_fiscal_quarters rel_fcf rel_capex rel_ocf q4r_fcf q4r_capex q4r_ocf q1r_fcf q1r_capex q1r_ocf q2r_fcf q2r_capex q2r_ocf"><figcaption><h3>General Dynamics’ quarterly free cash flow falls</h3><p class="subtitle">USD millions · Reported quarterly cash flows · Free cash flow is non-GAAP</p></figcaption><div class="plot" role="img" aria-label="General Dynamics’ quarterly free cash flow falls. USD millions · Reported quarterly cash flows · Free cash flow is non-GAAP. Q3 2025: Operating cash 2,109; Free cash flow 1,897; Capital spending 212. Q4 2025: Operating cash 1,561; Free cash flow 952; Capital spending 609. Q1 2026: Operating cash 2,155; Free cash flow 1,952; Capital spending 203. Q2 2026: Operating cash 1,880; Free cash flow 1,646; Capital spending 234. Q3 2026: Operating cash 1,710; Free cash flow 1,229; Capital spending 481. Each full bar is operating cash, divided into capital spending and cash remaining after that spending. Bars share a zero baseline. First- and fourth-quarter day counts vary by year."><div aria-hidden="true"><div class="chart-row"><div class="row-head"><strong>Q3 2025</strong><span>Operating cash 2,109</span></div><div class="track stack"><span class="piece teal" style="width:88.02784%"></span><span class="piece gold" style="width:9.83759%"></span></div><div class="keys"><span><i class="swatch teal"></i>Free cash flow 1,897</span><span><i class="swatch gold"></i>Capital spending 212</span></div></div><div class="chart-row"><div class="row-head"><strong>Q4 2025</strong><span>Operating cash 1,561</span></div><div class="track stack"><span class="piece teal" style="width:44.17633%"></span><span class="piece gold" style="width:28.25986%"></span></div><div class="keys"><span><i class="swatch teal"></i>Free cash flow 952</span><span><i class="swatch gold"></i>Capital spending 609</span></div></div><div class="chart-row"><div class="row-head"><strong>Q1 2026</strong><span>Operating cash 2,155</span></div><div class="track stack"><span class="piece teal" style="width:90.58005%"></span><span class="piece gold" style="width:9.41995%"></span></div><div class="keys"><span><i class="swatch teal"></i>Free cash flow 1,952</span><span><i class="swatch gold"></i>Capital spending 203</span></div></div><div class="chart-row"><div class="row-head"><strong>Q2 2026</strong><span>Operating cash 1,880</span></div><div class="track stack"><span class="piece teal" style="width:76.38051%"></span><span class="piece gold" style="width:10.85847%"></span></div><div class="keys"><span><i class="swatch teal"></i>Free cash flow 1,646</span><span><i class="swatch gold"></i>Capital spending 234</span></div></div><div class="chart-row"><div class="row-head"><strong>Q3 2026</strong><span>Operating cash 1,710</span></div><div class="track stack"><span class="piece teal" style="width:57.03016%"></span><span class="piece gold" style="width:22.32019%"></span></div><div class="keys"><span><i class="swatch teal"></i>Free cash flow 1,229</span><span><i class="swatch gold"></i>Capital spending 481</span></div></div></div></div><p class="annotation">Each full bar is operating cash, divided into capital spending and cash remaining after that spending. Bars share a zero baseline. First- and fourth-quarter day counts vary by year.</p><div class="graphic-footer"><span>Source: General Dynamics releases, filings and presentations · As of October 30, 2026<sup class="refs"><a id="ref-2-4" href="#src-earnings-gd-2026-q3-2" aria-label="Source 2">2</a>, <a id="ref-1-3" href="#src-earnings-gd-2026-q3-1" aria-label="Source 1">1</a>, <a id="ref-3-2" href="#src-earnings-gd-2026-q3-3" aria-label="Source 3">3</a>, <a id="ref-4-2" href="#src-earnings-gd-2026-q3-4" aria-label="Source 4">4</a>, <a id="ref-5-1" href="#src-earnings-gd-2026-q3-5" aria-label="Source 5">5</a></sup></span><strong>TGOs</strong></div></figure>
<p><span data-evidence="c_q3_fcf_decline_ocf_share c_q3_fcf_decline_capex_share">Lower operating cash accounts for 59.7% of the free-cash-flow decline, with higher capital spending accounting for the rest.</span> <span data-evidence="c_q3_fcf_bridge">That decomposition separates the two movements without assigning a business cause to each operating-cash line.</span><sup class="refs"><a id="ref-2-5" href="#src-earnings-gd-2026-q3-2" aria-label="Source 2">2</a></sup></p>
<section class="data-table" data-evidence="c_q3_25_ocf_pct_ne c_q3_ocf_pct_ne d_fcf_pct_q3"><h3>Cash conversion falls on both measures</h3><div class="table-scroll"><table><thead><tr><th scope="col">Percent of net earnings</th><th scope="col">Q3 2025</th><th scope="col">Q3 2026</th></tr></thead><tbody><tr data-evidence="c_q3_25_ocf_pct_ne c_q3_ocf_pct_ne"><th scope="row">Operating cash</th><td>199%</td><td>139%</td></tr><tr data-evidence="d_fcf_pct_q3"><th scope="row">Free cash flow, non-GAAP</th><td>179%</td><td>100%</td></tr></tbody></table></div><p class="table-note"><sup class="refs"><a id="ref-2-6" href="#src-earnings-gd-2026-q3-2" aria-label="Source 2">2</a>, <a id="ref-6-1" href="#src-earnings-gd-2026-q3-6" aria-label="Source 6">6</a></sup></p></section>
<p><span data-evidence="c_9m_fcf_growth c_9m_ocf_growth">The nine-month picture remains stronger: free cash flow increased 60.5%, while operating cash rose 61.4%.</span><sup class="refs"><a id="ref-2-7" href="#src-earnings-gd-2026-q3-2" aria-label="Source 2">2</a></sup> <span data-evidence="rel_9m_rev q_fiscal_quarters">Those year-to-date comparisons run through October 4, 2026, and September 28, 2025; the 2026 window is six calendar days longer.</span><sup class="refs"><a id="ref-2-8" href="#src-earnings-gd-2026-q3-2" aria-label="Source 2">2</a>, <a id="ref-1-4" href="#src-earnings-gd-2026-q3-1" aria-label="Source 1">1</a></sup></p>
<section class="data-table" data-evidence="rel_ocf rel_capex rel_fcf rel_9m_rev"><h3>Nine-month cash generation remains above the prior year</h3><div class="table-scroll"><table><thead><tr><th scope="col">USD millions</th><th scope="col">9M 2025</th><th scope="col">9M 2026</th></tr></thead><tbody><tr data-evidence="rel_ocf"><th scope="row">Operating cash, GAAP</th><td>3,559</td><td>5,745</td></tr><tr data-evidence="rel_capex"><th scope="row">Capital expenditures, outflows shown positive</th><td>552</td><td>918</td></tr><tr data-evidence="rel_fcf"><th scope="row">Free cash flow, non-GAAP</th><td>3,007</td><td>4,827</td></tr></tbody></table></div><p class="table-note">Periods end September 28, 2025, and October 4, 2026. The 2026 period is six calendar days longer.<sup class="refs"><a id="ref-2-9" href="#src-earnings-gd-2026-q3-2" aria-label="Source 2">2</a></sup></p></section>
<h2 data-evidence="c_q3_wc5_chg" id="section-earnings-gd-2026-q3-2">GD’s five named working-capital lines improve in aggregate</h2>
<p><span data-evidence="c_q3cf_ocf_26 c_q3cf_ocf_25">Subtracting GD’s six-month cash statements from its nine-month statements isolates the quarterly movements.</span> <span data-evidence="c_q3_wc5_chg c_q3_earn_noncash_chg">The five named working-capital lines contributed more cash than a year earlier in aggregate, alongside higher earnings and selected non-cash charges.</span> <span data-evidence="c_q3_dtax_oth_chg c_q3_bridge_check">Deferred income tax and operating Other, net more than offset those gains.</span><sup class="refs"><a id="ref-1-5" href="#src-earnings-gd-2026-q3-1" aria-label="Source 1">1</a>, <a id="ref-7-1" href="#src-earnings-gd-2026-q3-7" aria-label="Source 7">7</a></sup></p>
<figure id="quarterly-cash-bridge" class="gfx" data-evidence="c_q3_wc5_26 c_q3_wc5_25 c_q3_earn_noncash_26 c_q3_earn_noncash_25 c_q3_bridge_check rel_ocf c_q3_earn_noncash_chg c_q3_wc5_chg c_q3_dtax_oth_chg"><figcaption><h3>Deferred tax and Other, net outweigh GD’s cash gains</h3><p class="subtitle">USD millions · Change from Q3 2025 to Q3 2026 · Derived from six- and nine-month cash flow statements</p></figcaption><div class="plot" role="img" aria-label="Deferred tax and Other, net outweigh GD’s cash gains. USD millions · Change from Q3 2025 to Q3 2026 · Derived from six- and nine-month cash flow statements. Q3 2025 operating cash: 2,109. Earnings and selected non-cash charges: +184. Five working-capital lines: +86. Deferred tax and Other, net: -669. Q3 2026 operating cash: 1,710. Working capital here includes accounts receivable, unbilled receivables, inventories, accounts payable and customer advances. Selected non-cash charges are depreciation, amortization and equity compensation. This is a line-item reconciliation, not a causal attribution."><div aria-hidden="true"><div class="chart-row"><div class="row-head"><strong>Q3 2025 operating cash</strong><span>2,109</span></div><div class="track waterfall"><span class="piece teal" style="left:0.00000%;width:88.65069%"></span></div></div><div class="chart-row"><div class="row-head"><strong>Earnings and selected non-cash charges</strong><span>+184</span></div><div class="track waterfall"><span class="piece gold" style="left:88.65069%;width:7.73434%"></span></div></div><div class="chart-row"><div class="row-head"><strong>Five working-capital lines</strong><span>+86</span></div><div class="track waterfall"><span class="piece gold" style="left:96.38504%;width:3.61496%"></span></div></div><div class="chart-row"><div class="row-head"><strong>Deferred tax and Other, net</strong><span>-669</span></div><div class="track waterfall"><span class="piece rust" style="left:71.87894%;width:28.12106%"></span></div></div><div class="chart-row"><div class="row-head"><strong>Q3 2026 operating cash</strong><span>1,710</span></div><div class="track waterfall"><span class="piece teal" style="left:0.00000%;width:71.87894%"></span></div></div></div></div><p class="annotation">Working capital here includes accounts receivable, unbilled receivables, inventories, accounts payable and customer advances. Selected non-cash charges are depreciation, amortization and equity compensation. This is a line-item reconciliation, not a causal attribution.</p><div class="graphic-footer"><span>Source: General Dynamics releases, filings and presentations · As of October 30, 2026<sup class="refs"><a id="ref-2-10" href="#src-earnings-gd-2026-q3-2" aria-label="Source 2">2</a>, <a id="ref-1-6" href="#src-earnings-gd-2026-q3-1" aria-label="Source 1">1</a>, <a id="ref-7-2" href="#src-earnings-gd-2026-q3-7" aria-label="Source 7">7</a></sup></span><strong>TGOs</strong></div></figure>
<p><span data-evidence="c_q3chg_ar c_q3chg_unb">The aggregate working-capital improvement masks opposing movements: accounts receivable moved against cash by $429 million, while unbilled receivables improved by $581 million.</span> <span data-evidence="c_q3chg_adv c_q3chg_inv c_q3chg_ap">Customer advances also improved; inventories and accounts payable moved against cash.</span><sup class="refs"><a id="ref-1-7" href="#src-earnings-gd-2026-q3-1" aria-label="Source 1">1</a>, <a id="ref-7-3" href="#src-earnings-gd-2026-q3-7" aria-label="Source 7">7</a></sup></p>
<p><span data-evidence="c_q3chg_dtax c_q3chg_oth">The deferred-tax line moved against cash by $279 million, and Other, net moved against it by $390 million.</span> <span data-evidence="q_ocf_driver q_cf9_dtax q2k_cf6_dtax">The filing does not explain the deferred-tax swing or provide a separate quarterly cash narrative.</span><sup class="refs"><a id="ref-1-8" href="#src-earnings-gd-2026-q3-1" aria-label="Source 1">1</a>, <a id="ref-7-4" href="#src-earnings-gd-2026-q3-7" aria-label="Source 7">7</a></sup></p>
<p><span data-evidence="q_pension q_ocf_driver">GD contributed $500 million to its qualified pension plans during Q3 and includes that payment among its nine-month operating cash outflows.</span><sup class="refs"><a id="ref-1-9" href="#src-earnings-gd-2026-q3-1" aria-label="Source 1">1</a></sup> <span data-evidence="q_pension q_ocf_driver q325k_ocf_driver">The filing does not identify the payment’s cash-flow line, and we could not establish a comparable contribution for Q3 2025.</span> <span data-evidence="q_pension q_ocf_driver q325k_ocf_driver">The evidence therefore does not support treating the entire pension payment as an incremental year-over-year explanation.</span><sup class="refs"><a id="ref-1-10" href="#src-earnings-gd-2026-q3-1" aria-label="Source 1">1</a>, <a id="ref-8-1" href="#src-earnings-gd-2026-q3-8" aria-label="Source 8">8</a></sup></p>
<p><span data-evidence="q_cf9_adv q2k_cf6_adv c_q3cf_adv_26">Customer advances help explain the distance between the strong nine-month totals and the smaller latest-quarter inflow.</span> <span data-evidence="c_adv_h1_share_9m">By the end of the first half, GD had already recorded 94.8% of its nine-month advance inflow.</span><sup class="refs"><a id="ref-1-11" href="#src-earnings-gd-2026-q3-1" aria-label="Source 1">1</a>, <a id="ref-7-5" href="#src-earnings-gd-2026-q3-7" aria-label="Source 7">7</a></sup></p>
<section class="data-table" data-evidence="q1r_adv c_adv_q2_25 c_adv_q2_26 c_q3cf_adv_25 c_q3cf_adv_26 q_fiscal_quarters"><h3>Most of the 2026 advance inflow arrived in the first half</h3><div class="table-scroll"><table><thead><tr><th scope="col">Customer advances and deposits, USD millions</th><th scope="col">2025</th><th scope="col">2026</th></tr></thead><tbody><tr data-evidence="q1r_adv"><th scope="row">Q1</th><td>13</td><td>764</td></tr><tr data-evidence="c_adv_q2_25 c_adv_q2_26"><th scope="row">Q2, derived</th><td>93</td><td>404</td></tr><tr data-evidence="c_q3cf_adv_25 c_q3cf_adv_26"><th scope="row">Q3, derived</th><td>-61</td><td>64</td></tr></tbody></table></div><p class="table-note">Positive values contribute cash; negative values use cash. Q2 is six months less Q1; Q3 is nine months less six months. First-quarter day counts vary by year.<sup class="refs"><a id="ref-1-12" href="#src-earnings-gd-2026-q3-1" aria-label="Source 1">1</a>, <a id="ref-7-6" href="#src-earnings-gd-2026-q3-7" aria-label="Source 7">7</a>, <a id="ref-4-3" href="#src-earnings-gd-2026-q3-4" aria-label="Source 4">4</a></sup></p></section>
<p><span data-evidence="c_adv_share_9m_ocf_increase">The nine-month improvement in customer advances equals 54.3% of the operating-cash increase, an arithmetic share rather than GD’s attribution.</span><sup class="refs"><a id="ref-2-11" href="#src-earnings-gd-2026-q3-2" aria-label="Source 2">2</a>, <a id="ref-1-13" href="#src-earnings-gd-2026-q3-1" aria-label="Source 1">1</a></sup> <span data-evidence="q_ocf_driver">GD identifies net earnings as the primary cash driver and credits working-capital reductions particularly in Combat Systems and Aerospace.</span><sup class="refs"><a id="ref-1-14" href="#src-earnings-gd-2026-q3-1" aria-label="Source 1">1</a></sup> <span data-evidence="q_ocf_driver q_cf9_adv q2k_cf6_adv">The cash explanation does not identify which customers paid the advances or explain their slower inflow during Q3.</span><sup class="refs"><a id="ref-1-15" href="#src-earnings-gd-2026-q3-1" aria-label="Source 1">1</a>, <a id="ref-7-7" href="#src-earnings-gd-2026-q3-7" aria-label="Source 7">7</a></sup></p>
<h2 data-evidence="c_marine_share_q3_capex_increase" id="section-earnings-gd-2026-q3-3">Marine takes most of the added capital spending</h2>
<p><span data-evidence="q_segcapex_q3_marine q_segcapex_q3_aero q_segcapex_q3_combat">The investment increase was concentrated in Marine, though Aerospace and Combat Systems also spent more.</span> <span data-evidence="q_env_navy">GD describes investment in facilities and its workforce to raise capacity for Navy submarine demand.</span><sup class="refs"><a id="ref-1-16" href="#src-earnings-gd-2026-q3-1" aria-label="Source 1">1</a></sup></p>
<figure id="segment-capex" class="gfx" data-evidence="c_marine_share_q3_capex_increase q_env_navy q_segcapex_q3_aero q_segcapex_q3_marine q_segcapex_q3_combat q_segcapex_q3_tech"><figcaption><h3>Marine Systems leads GD’s capital-spending increase</h3><p class="subtitle">USD millions · Q3 capital expenditures · Both years use the same zero-based scale</p></figcaption><div class="plot" role="img" aria-label="Marine Systems leads GD’s capital-spending increase. USD millions · Q3 capital expenditures · Both years use the same zero-based scale. Aerospace: 2025 43; 2026 89. Marine Systems: 2025 96; 2026 303. Combat Systems: 2025 35; 2026 65. Technologies: 2025 38; 2026 24. Marine supplied 77.0% of the year-over-year increase. Spending does not establish when additional capacity enters service."><div aria-hidden="true"><div class="chart-row"><strong>Aerospace</strong><div class="pair"><span class="year">2025</span><div class="track"><span class="piece muted" style="width:14.19142%"></span></div><span class="amount">43</span></div><div class="pair"><span class="year">2026</span><div class="track"><span class="piece teal" style="width:29.37294%"></span></div><span class="amount">89</span></div></div><div class="chart-row"><strong>Marine Systems</strong><div class="pair"><span class="year">2025</span><div class="track"><span class="piece muted" style="width:31.68317%"></span></div><span class="amount">96</span></div><div class="pair"><span class="year">2026</span><div class="track"><span class="piece teal" style="width:100.00000%"></span></div><span class="amount">303</span></div></div><div class="chart-row"><strong>Combat Systems</strong><div class="pair"><span class="year">2025</span><div class="track"><span class="piece muted" style="width:11.55116%"></span></div><span class="amount">35</span></div><div class="pair"><span class="year">2026</span><div class="track"><span class="piece teal" style="width:21.45215%"></span></div><span class="amount">65</span></div></div><div class="chart-row"><strong>Technologies</strong><div class="pair"><span class="year">2025</span><div class="track"><span class="piece muted" style="width:12.54125%"></span></div><span class="amount">38</span></div><div class="pair"><span class="year">2026</span><div class="track"><span class="piece teal" style="width:7.92079%"></span></div><span class="amount">24</span></div></div></div></div><p class="annotation">Marine supplied 77.0% of the year-over-year increase. Spending does not establish when additional capacity enters service.</p><div class="graphic-footer"><span>Source: General Dynamics releases, filings and presentations · As of October 30, 2026<sup class="refs"><a id="ref-1-17" href="#src-earnings-gd-2026-q3-1" aria-label="Source 1">1</a></sup></span><strong>TGOs</strong></div></figure>
<p><span data-evidence="c_marine_capex_to_da_q3">Marine’s capital spending was 4.2 times its quarterly depreciation and amortization.</span> <span data-evidence="q_segcapex_q3_marine">The comparison shows the scale of current investment relative to those accounting charges; it does not measure new production capacity.</span><sup class="refs"><a id="ref-1-18" href="#src-earnings-gd-2026-q3-1" aria-label="Source 1">1</a></sup> <span data-evidence="eb_award q_segcapex_q3_marine">The available disclosures do not separate Navy-supported infrastructure investment from GD-funded spending.</span><sup class="refs"><a id="ref-1-19" href="#src-earnings-gd-2026-q3-1" aria-label="Source 1">1</a>, <a id="ref-9-1" href="#src-earnings-gd-2026-q3-9" aria-label="Source 9">9</a></sup></p>
<p><span data-evidence="q2k_capex_text q_capex_text">GD had already forecast rising second-half capital expenditures in July and now expects spending to remain elevated in Q4.</span><sup class="refs"><a id="ref-1-20" href="#src-earnings-gd-2026-q3-1" aria-label="Source 1">1</a>, <a id="ref-7-8" href="#src-earnings-gd-2026-q3-7" aria-label="Source 7">7</a></sup> <span data-evidence="c_marine_share_9m_capex">Marine accounted for 57.0% of capital spending over the first nine months.</span><sup class="refs"><a id="ref-1-21" href="#src-earnings-gd-2026-q3-1" aria-label="Source 1">1</a></sup></p>
<h2 data-evidence="c_q3_deploy_26 rel_fcf" id="section-earnings-gd-2026-q3-4">Dividends, buybacks and note repayments nearly match Q3 free cash flow</h2>
<p><span data-evidence="c_q3_deploy_26 rel_fcf">Dividends, share repurchases and fixed-rate note repayments together used $1.214 billion in Q3 2026, close to the cash remaining after capital spending.</span><sup class="refs"><a id="ref-2-12" href="#src-earnings-gd-2026-q3-2" aria-label="Source 2">2</a>, <a id="ref-1-22" href="#src-earnings-gd-2026-q3-1" aria-label="Source 1">1</a>, <a id="ref-7-9" href="#src-earnings-gd-2026-q3-7" aria-label="Source 7">7</a></sup></p>
<section class="data-table" data-evidence="c_q3cf_div_26 c_q3cf_buyback_26 c_q3cf_notes_26 c_q3_deploy_26 rel_fcf"><h3>Selected Q3 2026 cash uses compared with free cash flow</h3><div class="table-scroll"><table><thead><tr><th scope="col">USD millions; outflows shown positive</th><th scope="col">Q3 2026</th></tr></thead><tbody><tr data-evidence="c_q3cf_div_26"><th scope="row">Dividends</th><td>429</td></tr><tr data-evidence="c_q3cf_buyback_26"><th scope="row">Share repurchases</th><td>285</td></tr><tr data-evidence="c_q3cf_notes_26"><th scope="row">Fixed-rate note repayments</th><td>500</td></tr><tr data-evidence="c_q3_deploy_26"><th scope="row">Sum of these three uses</th><td>1,214</td></tr><tr data-evidence="rel_fcf"><th scope="row">Free cash flow, non-GAAP</th><td>1,229</td></tr></tbody></table></div><p class="table-note">Quarterly uses are derived from six- and nine-month statements. These selected uses are not a complete reconciliation of the change in cash.<sup class="refs"><a id="ref-2-13" href="#src-earnings-gd-2026-q3-2" aria-label="Source 2">2</a>, <a id="ref-1-23" href="#src-earnings-gd-2026-q3-1" aria-label="Source 1">1</a>, <a id="ref-7-10" href="#src-earnings-gd-2026-q3-7" aria-label="Source 7">7</a></sup></p></section>
<p><span data-evidence="q_debt_repay">GD repaid the quarter’s maturing notes in August using cash on hand.</span><sup class="refs"><a id="ref-1-24" href="#src-earnings-gd-2026-q3-1" aria-label="Source 1">1</a></sup> <span data-evidence="c_q3_cash_chg rel_netdebt">Cash and equivalents rose $55 million during Q3 to $4.388 billion.</span><sup class="refs"><a id="ref-2-14" href="#src-earnings-gd-2026-q3-2" aria-label="Source 2">2</a>, <a id="ref-7-11" href="#src-earnings-gd-2026-q3-7" aria-label="Source 7">7</a></sup></p>
<p><span data-evidence="c_net_debt_chg rel_netdebt">Net debt, a non-GAAP measure, fell $3.052 billion from year-end to $2.628 billion.</span><sup class="refs"><a id="ref-2-15" href="#src-earnings-gd-2026-q3-2" aria-label="Source 2">2</a></sup> <span data-evidence="q_liquidity">GD had no commercial paper outstanding on October 4 and retained a $4 billion committed bank credit facility.</span> <span data-evidence="q_buyback">The company describes its nine-month share repurchases as covering dilution.</span><sup class="refs"><a id="ref-1-25" href="#src-earnings-gd-2026-q3-1" aria-label="Source 1">1</a></sup></p>
<h2 data-evidence="c_rev_exmarine_growth q_cons_driver" id="section-earnings-gd-2026-q3-5">Growth extends beyond Marine Systems</h2>
<p><span data-evidence="rel_rev rel_oe q_cons_driver">Consolidated revenue and operating earnings increased from Q3 2025, with revenue growth across all four segments.</span><sup class="refs"><a id="ref-2-16" href="#src-earnings-gd-2026-q3-2" aria-label="Source 2">2</a>, <a id="ref-1-26" href="#src-earnings-gd-2026-q3-1" aria-label="Source 1">1</a></sup> <span data-evidence="q2k_cons_q2 q_cons_q3">Both measures also rose from the preceding quarter.</span><sup class="refs"><a id="ref-1-27" href="#src-earnings-gd-2026-q3-1" aria-label="Source 1">1</a>, <a id="ref-7-12" href="#src-earnings-gd-2026-q3-7" aria-label="Source 7">7</a></sup></p>
<section class="data-table" data-evidence="rel_rev q2k_cons_q2 rel_oe q_cons_q3"><h3>Consolidated results improve from both comparison quarters</h3><div class="table-scroll"><table><thead><tr><th scope="col">GAAP measure</th><th scope="col">Q3 2025</th><th scope="col">Q2 2026</th><th scope="col">Q3 2026</th></tr></thead><tbody><tr data-evidence="rel_rev q2k_cons_q2"><th scope="row">Revenue, USD millions</th><td>12,907</td><td>14,094</td><td>14,566</td></tr><tr data-evidence="rel_oe q2k_cons_q2"><th scope="row">Operating earnings, USD millions</th><td>1,331</td><td>1,460</td><td>1,527</td></tr><tr data-evidence="q_cons_q3 q2k_cons_q2"><th scope="row">Operating margin</th><td>10.3%</td><td>10.4%</td><td>10.5%</td></tr></tbody></table></div><p class="table-note"><sup class="refs"><a id="ref-2-17" href="#src-earnings-gd-2026-q3-2" aria-label="Source 2">2</a>, <a id="ref-1-28" href="#src-earnings-gd-2026-q3-1" aria-label="Source 1">1</a>, <a id="ref-7-13" href="#src-earnings-gd-2026-q3-7" aria-label="Source 7">7</a></sup></p></section>
<p><span data-evidence="c_marine_share_rev_growth c_marine_share_oe_growth">Marine supplied 52.1% of consolidated revenue growth and 51.0% of operating-earnings growth.</span> <span data-evidence="c_rev_exmarine_growth">Excluding Marine, revenue still increased 9.0%.</span><sup class="refs"><a id="ref-1-29" href="#src-earnings-gd-2026-q3-1" aria-label="Source 1">1</a></sup></p>
<figure id="segment-margins" class="gfx" data-evidence="q_aero_q3 q_marine_q3 q_combat_q3 q_tech_q3"><figcaption><h3>GD’s margin gains concentrate in Aerospace and Marine</h3><p class="subtitle">Q3 operating margin, percent · All four reported segments · Shared scale starts at zero</p></figcaption><div class="plot" role="img" aria-label="GD’s margin gains concentrate in Aerospace and Marine. Q3 operating margin, percent · All four reported segments · Shared scale starts at zero. Aerospace: 2025 13.3%; 2026 14.5%. Marine Systems: 2025 7.1%; 2026 7.9%. Combat Systems: 2025 14.9%; 2026 13.8%. Technologies: 2025 9.8%; 2026 9.4%. Combat Systems and Technologies generated more revenue but reported lower operating margins."><div aria-hidden="true"><div class="chart-row"><strong>Aerospace</strong><div class="pair"><span class="year">2025</span><div class="track"><span class="piece muted" style="width:83.12500%"></span></div><span class="amount">13.3%</span></div><div class="pair"><span class="year">2026</span><div class="track"><span class="piece teal" style="width:90.62500%"></span></div><span class="amount">14.5%</span></div></div><div class="chart-row"><strong>Marine Systems</strong><div class="pair"><span class="year">2025</span><div class="track"><span class="piece muted" style="width:44.37500%"></span></div><span class="amount">7.1%</span></div><div class="pair"><span class="year">2026</span><div class="track"><span class="piece teal" style="width:49.37500%"></span></div><span class="amount">7.9%</span></div></div><div class="chart-row"><strong>Combat Systems</strong><div class="pair"><span class="year">2025</span><div class="track"><span class="piece muted" style="width:93.12500%"></span></div><span class="amount">14.9%</span></div><div class="pair"><span class="year">2026</span><div class="track"><span class="piece teal" style="width:86.25000%"></span></div><span class="amount">13.8%</span></div></div><div class="chart-row"><strong>Technologies</strong><div class="pair"><span class="year">2025</span><div class="track"><span class="piece muted" style="width:61.25000%"></span></div><span class="amount">9.8%</span></div><div class="pair"><span class="year">2026</span><div class="track"><span class="piece teal" style="width:58.75000%"></span></div><span class="amount">9.4%</span></div></div></div></div><p class="annotation">Combat Systems and Technologies generated more revenue but reported lower operating margins.</p><div class="graphic-footer"><span>Source: General Dynamics releases, filings and presentations · As of October 30, 2026<sup class="refs"><a id="ref-1-30" href="#src-earnings-gd-2026-q3-1" aria-label="Source 1">1</a></sup></span><strong>TGOs</strong></div></figure>
<p><span data-evidence="rel_interest">Net interest expense also fell to $45 million from $74 million, helping net earnings beyond the operating improvement.</span><sup class="refs"><a id="ref-2-18" href="#src-earnings-gd-2026-q3-2" aria-label="Source 2">2</a></sup> <span data-evidence="q_interest_text">For the nine-month period, GD attributes lower net interest expense to less commercial-paper interest and more interest income on larger cash balances.</span><sup class="refs"><a id="ref-1-31" href="#src-earnings-gd-2026-q3-1" aria-label="Source 1">1</a></sup></p>
<section class="data-table" data-evidence="rel_netearn rel_eps"><h3>Net earnings and diluted EPS increase year over year</h3><div class="table-scroll"><table><thead><tr><th scope="col">GAAP measure</th><th scope="col">Q3 2025</th><th scope="col">Q3 2026</th></tr></thead><tbody><tr data-evidence="rel_netearn"><th scope="row">Net earnings, USD millions</th><td>1,059</td><td>1,229</td></tr><tr data-evidence="rel_eps"><th scope="row">Diluted EPS, USD</th><td>$3.88</td><td>$4.49</td></tr></tbody></table></div><p class="table-note"><sup class="refs"><a id="ref-2-19" href="#src-earnings-gd-2026-q3-2" aria-label="Source 2">2</a></sup></p></section>
<h3 data-evidence="q_aero_drivers">Aerospace gains from deliveries, mix and services</h3>
<p><span data-evidence="q_aero_q3">Aerospace operating earnings rose to $513 million from $430 million.</span> <span data-evidence="q_aero_drivers">GD attributes manufacturing earnings growth to aircraft deliveries and mix, and services earnings growth to volume and mix.</span><sup class="refs"><a id="ref-1-32" href="#src-earnings-gd-2026-q3-1" aria-label="Source 1">1</a></sup></p>
<p><span data-evidence="q_aero_oe_bridge">In GD’s earnings bridge, aircraft services contributed $49 million of growth and manufacturing added $63 million.</span> <span data-evidence="q_aero_drivers q_aero_oe_bridge">Higher general, administrative and other expenses offset part of that increase; GD links higher selling expenses to strong aircraft orders.</span><sup class="refs"><a id="ref-1-33" href="#src-earnings-gd-2026-q3-1" aria-label="Source 1">1</a></sup></p>
<p><span data-evidence="q_aero_services_driver">The services business benefited from increased fixed-base operator activity and customer demand for aircraft maintenance, according to GD.</span><sup class="refs"><a id="ref-1-34" href="#src-earnings-gd-2026-q3-1" aria-label="Source 1">1</a></sup> <span data-evidence="rel_btb">Aerospace orders exceeded revenue, with a book-to-bill ratio of 1.4.</span><sup class="refs"><a id="ref-2-20" href="#src-earnings-gd-2026-q3-2" aria-label="Source 2">2</a></sup></p>
<p><span data-evidence="rel_deliveries">Gulfstream delivered 40 aircraft, compared with 39 a year earlier.</span><sup class="refs"><a id="ref-2-21" href="#src-earnings-gd-2026-q3-2" aria-label="Source 2">2</a></sup> <span data-evidence="q_aero_supply rel_deliveries">GD reports delays at its Israel-based supplier of mid-cabin airframes caused by Middle East conflicts, without attributing the quarter’s delivery mix to those delays.</span><sup class="refs"><a id="ref-2-22" href="#src-earnings-gd-2026-q3-2" aria-label="Source 2">2</a>, <a id="ref-1-35" href="#src-earnings-gd-2026-q3-1" aria-label="Source 1">1</a></sup></p>
<h3 data-evidence="q_marine_driver">Marine’s margin gains include a contract adjustment</h3>
<p><span data-evidence="q_marine_rev_bridge q_marine_driver">Marine’s revenue increase came mainly from U.S. Navy ship construction, which GD attributes to increased material and labor volume on Columbia- and Virginia-class submarines.</span> <span data-evidence="q_marine_rev_bridge">The MD&amp;A separates ship construction growth from the increase in engineering, repair and other services.</span><sup class="refs"><a id="ref-1-36" href="#src-earnings-gd-2026-q3-1" aria-label="Source 1">1</a></sup></p>
<section class="data-table" data-evidence="q_marine_rev_bridge"><h3>Marine’s revenue growth is concentrated in ship construction</h3><div class="table-scroll"><table><thead><tr><th scope="col">MD&amp;A category, USD millions</th><th scope="col">Q3 year-over-year increase</th></tr></thead><tbody><tr data-evidence="q_marine_rev_bridge"><th scope="row">U.S. Navy ship construction</th><td>661</td></tr><tr data-evidence="q_marine_rev_bridge"><th scope="row">Engineering, repair and other services</th><td>203</td></tr><tr data-evidence="q_marine_rev_bridge"><th scope="row">Marine Systems total</th><td>864</td></tr></tbody></table></div><p class="table-note"><sup class="refs"><a id="ref-1-37" href="#src-earnings-gd-2026-q3-1" aria-label="Source 1">1</a></sup></p></section>
<p><span data-evidence="q_marine_q3">Marine’s operating margin increased year over year.</span> <span data-evidence="q_marine_driver">GD attributes that year-over-year margin increase to improved performance and a favorable adjustment on Virginia-class Block IV as it nears completion.</span> <span data-evidence="q_marine_driver q_est_adj_nomaterial">The filing does not disclose the adjustment’s size and says no adjustment on any one contract was material.</span><sup class="refs"><a id="ref-1-38" href="#src-earnings-gd-2026-q3-1" aria-label="Source 1">1</a></sup></p>
<section class="data-table" data-evidence="q2k_marine_q2 q_marine_q3 q_marine_driver"><h3>Marine’s reported results also improve sequentially</h3><div class="table-scroll"><table><thead><tr><th scope="col">Measure</th><th scope="col">Q2 2026</th><th scope="col">Q3 2026</th></tr></thead><tbody><tr data-evidence="q2k_marine_q2 q_marine_q3"><th scope="row">Revenue, USD millions</th><td>4,660</td><td>4,960</td></tr><tr data-evidence="q2k_marine_q2 q_marine_q3"><th scope="row">Operating earnings, USD millions</th><td>342</td><td>391</td></tr><tr data-evidence="q2k_marine_q2 q_marine_q3"><th scope="row">Operating margin</th><td>7.3%</td><td>7.9%</td></tr></tbody></table></div><p class="table-note">GD’s explanation of the margin increase addresses the year-over-year comparison, not this sequential comparison.<sup class="refs"><a id="ref-1-39" href="#src-earnings-gd-2026-q3-1" aria-label="Source 1">1</a>, <a id="ref-7-14" href="#src-earnings-gd-2026-q3-7" aria-label="Source 7">7</a></sup></p></section>
<p><span data-evidence="q_est_adj">Across the company, net contract-estimate adjustments added $44 million to quarterly operating earnings, down from $57 million.</span> <span data-evidence="c_oe_ex_adj_growth">Excluding those aggregate net adjustments, operating earnings grew 16.4% by our calculation; this is not a GD-reported performance measure.</span> <span data-evidence="q_est_adj q_marine_driver">The aggregate figures do not isolate Marine’s underlying margin or show how its favorable adjustment compares with adjustments on other contracts.</span><sup class="refs"><a id="ref-1-40" href="#src-earnings-gd-2026-q3-1" aria-label="Source 1">1</a></sup></p>
<p><span data-evidence="q_eb_investigation">Separately, the SEC and the Justice Department’s Civil Division contacted GD in August about investigations into Electric Boat’s accounting on submarine contracts.</span> <span data-evidence="q_eb_investigation_outcome">GD cannot estimate a range of possible loss and says the outcome could be material.</span> <span data-evidence="q_eb_investigation q_marine_driver">The filing does not connect the investigations to the Block IV adjustment.</span><sup class="refs"><a id="ref-1-41" href="#src-earnings-gd-2026-q3-1" aria-label="Source 1">1</a></sup></p>
<h3 data-evidence="q_combat_driver">Artillery production drives Combat’s munitions growth</h3>
<p><span data-evidence="q_combat_q3">Combat Systems generated more revenue, while operating earnings fell to $330 million from $335 million.</span> <span data-evidence="q_combat_driver">GD attributes weapons-and-munitions growth to increased artillery production.</span> <span data-evidence="q_combat_driver">It attributes the lower segment margin to program mix, without identifying munitions as the cause.</span><sup class="refs"><a id="ref-1-42" href="#src-earnings-gd-2026-q3-1" aria-label="Source 1">1</a></sup></p>
<p><span data-evidence="q_combat_bridge">In the MD&amp;A revenue bridge, weapons and munitions account for the full quarterly increase; higher U.S. vehicle revenue and lower international vehicle revenue cancel each other.</span> <span data-evidence="q_combat_driver">For the nine-month period, GD attributes lower U.S. vehicle revenue to reduced Army demand during recapitalization and the termination of M10 Booker.</span><sup class="refs"><a id="ref-1-43" href="#src-earnings-gd-2026-q3-1" aria-label="Source 1">1</a></sup></p>
<p><span data-evidence="q_env_combat">GD expects short-term combat-vehicle production volumes to be down slightly and munitions demand to remain elevated.</span><sup class="refs"><a id="ref-1-44" href="#src-earnings-gd-2026-q3-1" aria-label="Source 1">1</a></sup> <span data-evidence="rel_bl_q325_combat q_bl_q2_combat q_bl_q3_combat">Combat backlog remained above a year earlier but declined during Q3.</span><sup class="refs"><a id="ref-2-23" href="#src-earnings-gd-2026-q3-2" aria-label="Source 2">2</a>, <a id="ref-1-45" href="#src-earnings-gd-2026-q3-1" aria-label="Source 1">1</a></sup></p>
<h3 data-evidence="d_tech_bullets">Technologies grows at both businesses</h3>
<p><span data-evidence="d_tech_bullets">Technologies recorded growth at both General Dynamics Information Technology and Mission Systems.</span><sup class="refs"><a id="ref-6-2" href="#src-earnings-gd-2026-q3-6" aria-label="Source 6">6</a></sup> <span data-evidence="q_tech_bridge">Information technology services contributed $220 million of quarterly revenue growth.</span> <span data-evidence="q_tech_bridge">Command, control, communications, computers, cyber, intelligence, surveillance and reconnaissance solutions supplied the remaining $139 million.</span><sup class="refs"><a id="ref-1-46" href="#src-earnings-gd-2026-q3-1" aria-label="Source 1">1</a></sup></p>
<p><span data-evidence="q_tech_q3 q_tech_driver">Operating earnings increased to $346 million from $327 million, while GD attributed the lower margin to program mix.</span><sup class="refs"><a id="ref-1-47" href="#src-earnings-gd-2026-q3-1" aria-label="Source 1">1</a></sup> <span data-evidence="rel_bl_q325_tech q_bl_q3_tech q_backlog_defs">Funded backlog rose year over year, strengthening the funded order book without establishing the timing of its conversion into revenue.</span><sup class="refs"><a id="ref-2-24" href="#src-earnings-gd-2026-q3-2" aria-label="Source 2">2</a>, <a id="ref-1-48" href="#src-earnings-gd-2026-q3-1" aria-label="Source 1">1</a></sup></p>
<h2 data-evidence="q_bl_q3_marine q_bl_q2_marine" id="section-earnings-gd-2026-q3-6">Marine’s backlog expands mainly through unfunded work</h2>
<p><span data-evidence="rel_orders">GD received $98.8 billion in quarterly orders, driven by submarine awards.</span> <span data-evidence="rel_btb">The defense segments’ book-to-bill ratio reached 8.5, measuring orders relative to revenue rather than cash receipts.</span><sup class="refs"><a id="ref-2-25" href="#src-earnings-gd-2026-q3-2" aria-label="Source 2">2</a></sup></p>
<p><span data-evidence="eb_award eb_quote">July contract modifications awarded to Electric Boat covered additional Columbia- and Virginia-class submarines, alongside support for shipyard infrastructure.</span> <span data-evidence="eb_award">The announced submarine contract values were $29.5 billion for Columbia and $42.1 billion for Virginia.</span><sup class="refs"><a id="ref-9-2" href="#src-earnings-gd-2026-q3-9" aria-label="Source 9">9</a></sup> <span data-evidence="eb_award q_bl_q3_marine q_bl_q2_marine">Marine’s funded backlog grew far less than these announced contract values.</span><sup class="refs"><a id="ref-1-49" href="#src-earnings-gd-2026-q3-1" aria-label="Source 1">1</a>, <a id="ref-9-3" href="#src-earnings-gd-2026-q3-9" aria-label="Source 9">9</a></sup></p>
<figure id="marine-backlog" class="gfx peak" data-evidence="q_backlog_defs rel_bl_q325_marine q1r_bl_marine_q4 q1r_bl_marine_q1 q_bl_q2_marine q_bl_q3_marine"><figcaption><h3>Unfunded work drives Marine Systems’ backlog expansion</h3><p class="subtitle">USD millions · Quarter-end Marine Systems backlog · Funded and unfunded work share one scale</p></figcaption><div class="plot" role="img" aria-label="Unfunded work drives Marine Systems’ backlog expansion. USD millions · Quarter-end Marine Systems backlog · Funded and unfunded work share one scale. Q3 2025: Total backlog 53,611; Funded 38,757; Unfunded 14,854. Q4 2025: Total backlog 52,340; Funded 36,808; Unfunded 15,532. Q1 2026: Total backlog 63,971; Funded 40,598; Unfunded 23,373. Q2 2026: Total backlog 65,182; Funded 42,356; Unfunded 22,826. Q3 2026: Total backlog 146,865; Funded 47,289; Unfunded 99,576. Most of the Q3 increase was unfunded. Funded defense backlog is authorized, appropriated and funded. Hatched portions show work GD believes likely to be funded, without a guarantee of future appropriations."><div aria-hidden="true"><div class="chart-row"><div class="row-head"><strong>Q3 2025</strong><span>Total backlog 53,611</span></div><div class="track stack"><span class="piece teal" style="width:26.38954%"></span><span class="piece hatched" style="width:10.11405%"></span></div><div class="keys"><span><i class="swatch teal"></i>Funded 38,757</span><span><i class="swatch hatched"></i>Unfunded 14,854</span></div></div><div class="chart-row"><div class="row-head"><strong>Q4 2025</strong><span>Total backlog 52,340</span></div><div class="track stack"><span class="piece teal" style="width:25.06247%"></span><span class="piece hatched" style="width:10.57570%"></span></div><div class="keys"><span><i class="swatch teal"></i>Funded 36,808</span><span><i class="swatch hatched"></i>Unfunded 15,532</span></div></div><div class="chart-row"><div class="row-head"><strong>Q1 2026</strong><span>Total backlog 63,971</span></div><div class="track stack"><span class="piece teal" style="width:27.64307%"></span><span class="piece hatched" style="width:15.91462%"></span></div><div class="keys"><span><i class="swatch teal"></i>Funded 40,598</span><span><i class="swatch hatched"></i>Unfunded 23,373</span></div></div><div class="chart-row"><div class="row-head"><strong>Q2 2026</strong><span>Total backlog 65,182</span></div><div class="track stack"><span class="piece teal" style="width:28.84009%"></span><span class="piece hatched" style="width:15.54216%"></span></div><div class="keys"><span><i class="swatch teal"></i>Funded 42,356</span><span><i class="swatch hatched"></i>Unfunded 22,826</span></div></div><div class="chart-row"><div class="row-head"><strong>Q3 2026</strong><span>Total backlog 146,865</span></div><div class="track stack"><span class="piece teal" style="width:32.19896%"></span><span class="piece hatched" style="width:67.80104%"></span></div><div class="keys"><span><i class="swatch teal"></i>Funded 47,289</span><span><i class="swatch hatched"></i>Unfunded 99,576</span></div></div></div></div><p class="annotation">Most of the Q3 increase was unfunded. Funded defense backlog is authorized, appropriated and funded. Hatched portions show work GD believes likely to be funded, without a guarantee of future appropriations.</p><div class="graphic-footer"><span>Source: General Dynamics releases, filings and presentations · As of October 30, 2026<sup class="refs"><a id="ref-2-26" href="#src-earnings-gd-2026-q3-2" aria-label="Source 2">2</a>, <a id="ref-1-50" href="#src-earnings-gd-2026-q3-1" aria-label="Source 1">1</a>, <a id="ref-4-4" href="#src-earnings-gd-2026-q3-4" aria-label="Source 4">4</a></sup></span><strong>TGOs</strong></div></figure>
<p><span data-evidence="q_rpo q2k_rpo">The expanded order book also changes the company-wide conversion profile.</span> <span data-evidence="q_rpo q2k_rpo">The share expected to become revenue by year-end 2027 fell, even as total remaining performance obligations grew.</span> <span data-evidence="q_rpo q2k_rpo">A smaller percentage of a larger backlog does not by itself establish a decline in near-term revenue dollars.</span><sup class="refs"><a id="ref-1-51" href="#src-earnings-gd-2026-q3-1" aria-label="Source 1">1</a>, <a id="ref-7-15" href="#src-earnings-gd-2026-q3-7" aria-label="Source 7">7</a></sup></p>
<section class="data-table" data-evidence="q2k_rpo q_rpo"><h3>GD expects a smaller share of backlog to convert by 2027</h3><div class="table-scroll"><table><thead><tr><th scope="col">Company-wide remaining performance obligations</th><th scope="col">July 5, 2026</th><th scope="col">October 4, 2026</th></tr></thead><tbody><tr data-evidence="q2k_rpo q_rpo"><th scope="row">Total, USD billions</th><td>$136.5</td><td>$220.3</td></tr><tr data-evidence="q2k_rpo q_rpo"><th scope="row">Expected revenue by year-end 2027</th><td>About 50%</td><td>About 30%</td></tr><tr data-evidence="q2k_rpo q_rpo"><th scope="row">Additional expected revenue by year-end 2029</th><td>About 30%</td><td>About 25%</td></tr></tbody></table></div><p class="table-note">The balance is expected thereafter. These are approximate forecast shares of different backlog totals, not cash receipts or obligations.<sup class="refs"><a id="ref-1-52" href="#src-earnings-gd-2026-q3-1" aria-label="Source 1">1</a>, <a id="ref-7-16" href="#src-earnings-gd-2026-q3-7" aria-label="Source 7">7</a></sup></p></section>
<h2 data-evidence="q_guide_rev q2d_cons_guide q_guide_eps q2d_eps_guide" id="section-earnings-gd-2026-q3-7">GD raises annual revenue and EPS targets</h2>
<p><span data-evidence="q_guide_rev q2d_cons_guide">GD raised its annual revenue forecast to $56.5 billion–$56.8 billion, compared with about $55.7 billion in July.</span> <span data-evidence="q_guide_rev q2d_cons_guide">Its operating-margin forecast remains around 10.5%.</span><sup class="refs"><a id="ref-1-53" href="#src-earnings-gd-2026-q3-1" aria-label="Source 1">1</a>, <a id="ref-10-1" href="#src-earnings-gd-2026-q3-10" aria-label="Source 10">10</a></sup></p>
<figure id="eps-outlook" class="gfx" data-evidence="q2d_eps_guide q2d_eps_april q_guide_eps"><figcaption><h3>General Dynamics raises its annual EPS outlook again</h3><p class="subtitle">FY2026 forecasts · Diluted earnings per share, USD · Update month</p></figcaption><div class="plot" role="img" aria-label="General Dynamics raises its annual EPS outlook again. FY2026 forecasts · Diluted earnings per share, USD · Update month. January: $16.10–$16.20. April: $16.45–$16.55. July: $16.80–$16.90. October: $17.20–$17.30. All marks are annual forecasts, not actual earnings. The labeled range scale does not start at zero."><div aria-hidden="true"><div class="range-axis"><span>$16.00</span><span>$17.50</span></div><div class="chart-row"><div class="row-head"><strong>January</strong><span>$16.10–$16.20</span></div><div class="range-track"><span class="range-mark" style="left:6.66667%;width:6.66667%"></span></div></div><div class="chart-row"><div class="row-head"><strong>April</strong><span>$16.45–$16.55</span></div><div class="range-track"><span class="range-mark" style="left:30.00000%;width:6.66667%"></span></div></div><div class="chart-row"><div class="row-head"><strong>July</strong><span>$16.80–$16.90</span></div><div class="range-track"><span class="range-mark" style="left:53.33333%;width:6.66667%"></span></div></div><div class="chart-row"><div class="row-head"><strong>October</strong><span>$17.20–$17.30</span></div><div class="range-track"><span class="range-mark" style="left:80.00000%;width:6.66667%"></span></div></div></div></div><p class="annotation">All marks are annual forecasts, not actual earnings. The labeled range scale does not start at zero.</p><div class="graphic-footer"><span>Source: General Dynamics releases, filings and presentations · As of October 30, 2026<sup class="refs"><a id="ref-1-54" href="#src-earnings-gd-2026-q3-1" aria-label="Source 1">1</a>, <a id="ref-10-2" href="#src-earnings-gd-2026-q3-10" aria-label="Source 10">10</a></sup></span><strong>TGOs</strong></div></figure>
<p><span data-evidence="q_guide_interest q2k_interest_guide">GD also lowered its annual net interest expense assumption to approximately $215 million, compared with $270 million in July.</span><sup class="refs"><a id="ref-1-55" href="#src-earnings-gd-2026-q3-1" aria-label="Source 1">1</a>, <a id="ref-7-17" href="#src-earnings-gd-2026-q3-7" aria-label="Source 7">7</a></sup> <span data-evidence="q_guide_rev q2d_cons_guide">That change sits alongside the higher revenue forecast and unchanged operating-margin target.</span><sup class="refs"><a id="ref-1-56" href="#src-earnings-gd-2026-q3-1" aria-label="Source 1">1</a>, <a id="ref-10-3" href="#src-earnings-gd-2026-q3-10" aria-label="Source 10">10</a></sup></p>
<section class="data-table" data-evidence="rel_9m_rev q_guide_rev rel_9m_eps q_guide_eps"><h3>Results entering the final quarter, alongside annual targets</h3><div class="table-scroll"><table><thead><tr><th scope="col">Measure</th><th scope="col">9M 2026 actual</th><th scope="col">FY2026 forecast</th></tr></thead><tbody><tr data-evidence="rel_9m_rev q_guide_rev"><th scope="row">Revenue, USD billions</th><td>$42.141 billion</td><td>$56.5 billion–$56.8 billion</td></tr><tr data-evidence="rel_9m_eps q_guide_eps"><th scope="row">Diluted EPS, USD</th><td>$12.83</td><td>$17.20–$17.30</td></tr></tbody></table></div><p class="table-note">Actual results cover the nine months ended October 4, 2026. Forecasts are the October annual outlook.<sup class="refs"><a id="ref-2-27" href="#src-earnings-gd-2026-q3-2" aria-label="Source 2">2</a>, <a id="ref-1-57" href="#src-earnings-gd-2026-q3-1" aria-label="Source 1">1</a></sup></p></section>
<p><span data-evidence="q4r_rev q4r_eps">For comparison, GD recorded $14.379 billion of revenue and $4.17 of diluted EPS in the final quarter of 2025.</span><sup class="refs"><a id="ref-5-2" href="#src-earnings-gd-2026-q3-5" aria-label="Source 5">5</a></sup> <span data-evidence="q_fiscal_quarters">First- and fourth-quarter day counts vary because GD’s fiscal year ends December 31.</span><sup class="refs"><a id="ref-1-58" href="#src-earnings-gd-2026-q3-1" aria-label="Source 1">1</a></sup></p>
<p><span data-evidence="q2d_aero_guide rel_deliveries">Gulfstream’s July outlook called for about 160 deliveries for the year; it had delivered 119 through Q3.</span><sup class="refs"><a id="ref-2-28" href="#src-earnings-gd-2026-q3-2" aria-label="Source 2">2</a>, <a id="ref-10-4" href="#src-earnings-gd-2026-q3-10" aria-label="Source 10">10</a></sup> <span data-evidence="q2d_aero_guide q_guide_scope">That remains a July-dated benchmark: the Q3 filing updates consolidated guidance without restating the segment outlooks.</span><sup class="refs"><a id="ref-1-59" href="#src-earnings-gd-2026-q3-1" aria-label="Source 1">1</a>, <a id="ref-10-5" href="#src-earnings-gd-2026-q3-10" aria-label="Source 10">10</a></sup></p>
<p><span data-evidence="q2k_marine_guide">Marine’s July outlook similarly called for about $18 billion of annual revenue and a margin of about 7.4%.</span><sup class="refs"><a id="ref-7-18" href="#src-earnings-gd-2026-q3-7" aria-label="Source 7">7</a></sup> <span data-evidence="q_marine_9m">Its nine-month revenue reached $13.963 billion, with a margin of 7.5%.</span> <span data-evidence="q_marine_driver">The favorable Block IV adjustment is part of the reported performance, and its undisclosed size limits conclusions about the margin that will carry into future work.</span><sup class="refs"><a id="ref-1-60" href="#src-earnings-gd-2026-q3-1" aria-label="Source 1">1</a></sup></p>
<p><span data-evidence="q_capex_text">The explicit near-term investment signal is that GD expects capital expenditures to remain elevated in Q4.</span> <span data-evidence="q_capex_text q_guide_eps q_guide_scope">The materials reviewed provide no free-cash-flow forecast, leaving the cash cost of that investment alongside the stronger annual earnings outlook.</span><sup class="refs"><a id="ref-1-61" href="#src-earnings-gd-2026-q3-1" aria-label="Source 1">1</a></sup></p></article><section class="sources"></section><footer class="site-footer">TGOs · Where the money’s going, who’s buying whom, and what it means for the mission.</footer><details class="srcs" open><summary>Sources (10)</summary><ol><li id="src-earnings-gd-2026-q3-1"><a href="https://www.sec.gov/Archives/edgar/data/40533/000004053326000038/gd-20261004.htm" rel=noopener>General Dynamics, Q3 2026 Form 10-Q</a></li><li id="src-earnings-gd-2026-q3-2"><a href="https://www.prnewswire.com/news-releases/general-dynamics-reports-third-quarter-2026-financial-results-302924010.html" rel=noopener>General Dynamics, Q3 2026 earnings release</a></li><li id="src-earnings-gd-2026-q3-3"><a href="https://www.prnewswire.com/news-releases/general-dynamics-reports-second-quarter-2026-financial-results-302836859.html" rel=noopener>General Dynamics, Q2 2026 earnings release</a></li><li id="src-earnings-gd-2026-q3-4"><a href="https://s22.q4cdn.com/891946778/files/doc_financials/2026/q1/GD-2026-04-05-Exhibit-99-1.pdf" rel=noopener>General Dynamics, Q1 2026 earnings release</a></li><li id="src-earnings-gd-2026-q3-5"><a href="https://www.prnewswire.com/news-releases/general-dynamics-reports-fourth-quarter-and-full-year-2025-financial-results-302671683.html" rel=noopener>General Dynamics, Q4 and full-year 2025 earnings release</a></li><li id="src-earnings-gd-2026-q3-6"><a href="https://s22.q4cdn.com/891946778/files/content_files/3Q26-Highlights.pdf" rel=noopener>General Dynamics, Q3 2026 highlights</a></li><li id="src-earnings-gd-2026-q3-7"><a href="https://s22.q4cdn.com/891946778/files/doc_financials/2026/q2/2Q26-10-Q-As-Filed.pdf" rel=noopener>General Dynamics, Q2 2026 Form 10-Q</a></li><li id="src-earnings-gd-2026-q3-8"><a href="https://s22.q4cdn.com/891946778/files/doc_financials/2025/q3/3Q25-10-Q.pdf" rel=noopener>General Dynamics, Q3 2025 Form 10-Q</a></li><li id="src-earnings-gd-2026-q3-9"><a href="https://www.prnewswire.com/news-releases/general-dynamics-electric-boat-awarded-construction-contracts-for-14-submarines-as-part-of-76-6-billion-navy-award-302838350.html" rel=noopener>General Dynamics Electric Boat, July 2026 submarine awards</a></li><li id="src-earnings-gd-2026-q3-10"><a href="https://s22.q4cdn.com/891946778/files/doc_financials/2026/q2/2Q26-Highlights-and-Outlook.pdf" rel=noopener>General Dynamics, Q2 2026 highlights and outlook</a></li></ol></details><section class="chart-downloads"><h2>Take the chart with you</h2><ul><li><a href="/earnings/gd-2026-q3/analysis/share.png" download>Share chart</a></li></ul></section></article><section class="connected-reporting"><h2>Follow the reporting</h2><ul class="cards"><li class="card"><a href="/news/2026/10/31/general-dynamics-marine-systems-backlog-more-than-doubles-to/"><span class="k">Brief</span><b>General Dynamics&#x27; Marine Systems backlog more than doubles to $146.9 billion</b><span class="d">Large submarine orders drove defense bookings, while most of the Marine Systems backlog increase was unfunded.</span><time datetime="2026-10-31">Oct 31, 2026</time></a></li></ul><p><a href="/earnings/gd-2026-q3/">General Dynamics · Q3 2026: earnings and company materials ↗</a></p></section>