# V2X's Q3 revenue growth rests on discrete mission activities

Canonical: https://tgos.io/earnings/vvx-2026-q3/analysis/

<article class="assess ax-earnings-vvx-2026-q3"><p class="kicker">Earnings analysis</p><h1>V2X&#x27;s Q3 revenue growth rests on discrete mission activities</h1><p class="dek">Removing the increase V2X attributes to discrete national security mission activities leaves a revenue decline in our calculation. Kuwait task-order revenue falls alongside Middle East revenue.</p><p class="byline"><time datetime="2026-11-04">November 4, 2026</time> · Earnings Assessment · V2X · Q3 2026 · Release and filing analysis</p><details class="assessment-contents"><summary>In this analysis</summary><nav aria-label="In this analysis"><ol><li><a href="#section-earnings-vvx-2026-q3-1">The remaining revenue change turns negative</a></li><li><a href="#section-earnings-vvx-2026-q3-2">Kuwait task-order revenue falls alongside Middle East revenue</a></li><li><a href="#section-earnings-vvx-2026-q3-3">The customer mix shifts away from the Army</a></li><li><a href="#section-earnings-vvx-2026-q3-4">Profit growth trails sales despite sequential margin recovery</a></li><li><a href="#section-earnings-vvx-2026-q3-5">Receivables activity separates the two cash measures</a></li><li><a href="#section-earnings-vvx-2026-q3-6">Debt falls in Q3 but remains above year-end</a></li><li><a href="#section-earnings-vvx-2026-q3-7">Most of the backlog increase is unfunded</a></li><li><a href="#section-earnings-vvx-2026-q3-8">Higher guidance still permits a Q4 revenue decline</a></li></ol></nav></details><header></header><article><p>V2X grew third-quarter revenue to $1,271.5 million, up 8.9% from a year earlier.<sup class="cite"><a id="ref-source-1-1" href="#src-earnings-vvx-2026-q3-1" role="doc-noteref" aria-label="Source 1">1</a></sup> The gain was smaller than the increase V2X attributed to discrete activities supporting a national security mission.<sup class="cite"><a id="ref-source-1-2" href="#src-earnings-vvx-2026-q3-1" role="doc-noteref" aria-label="Source 1">1</a>,<a id="ref-source-3-1" href="#src-earnings-vvx-2026-q3-2" role="doc-noteref" aria-label="Source 2">2</a></sup></p>
<p>That distinction changes the reading of the quarter: removing the disclosed increase leaves a $24.6 million decline, or approximately 2.1% of prior-year revenue, in our calculation.<sup class="cite"><a id="ref-source-1-3" href="#src-earnings-vvx-2026-q3-1" role="doc-noteref" aria-label="Source 1">1</a>,<a id="ref-source-3-2" href="#src-earnings-vvx-2026-q3-2" role="doc-noteref" aria-label="Source 2">2</a></sup> V2X also raised its full-year revenue forecast, while operating profit grew more slowly than sales.<sup class="cite"><a id="ref-source-1-4" href="#src-earnings-vvx-2026-q3-1" role="doc-noteref" aria-label="Source 1">1</a></sup></p>
<p>This Assessment covers V2X&#x27;s earnings releases and filings, including the quarter ended October 2, 2026.<sup class="cite"><a id="ref-source-1-5" href="#src-earnings-vvx-2026-q3-1" role="doc-noteref" aria-label="Source 1">1</a></sup> No conference-call content or analyst Q&amp;A was reviewed.</p>
<h2 id="section-earnings-vvx-2026-q3-1">The remaining revenue change turns negative</h2>
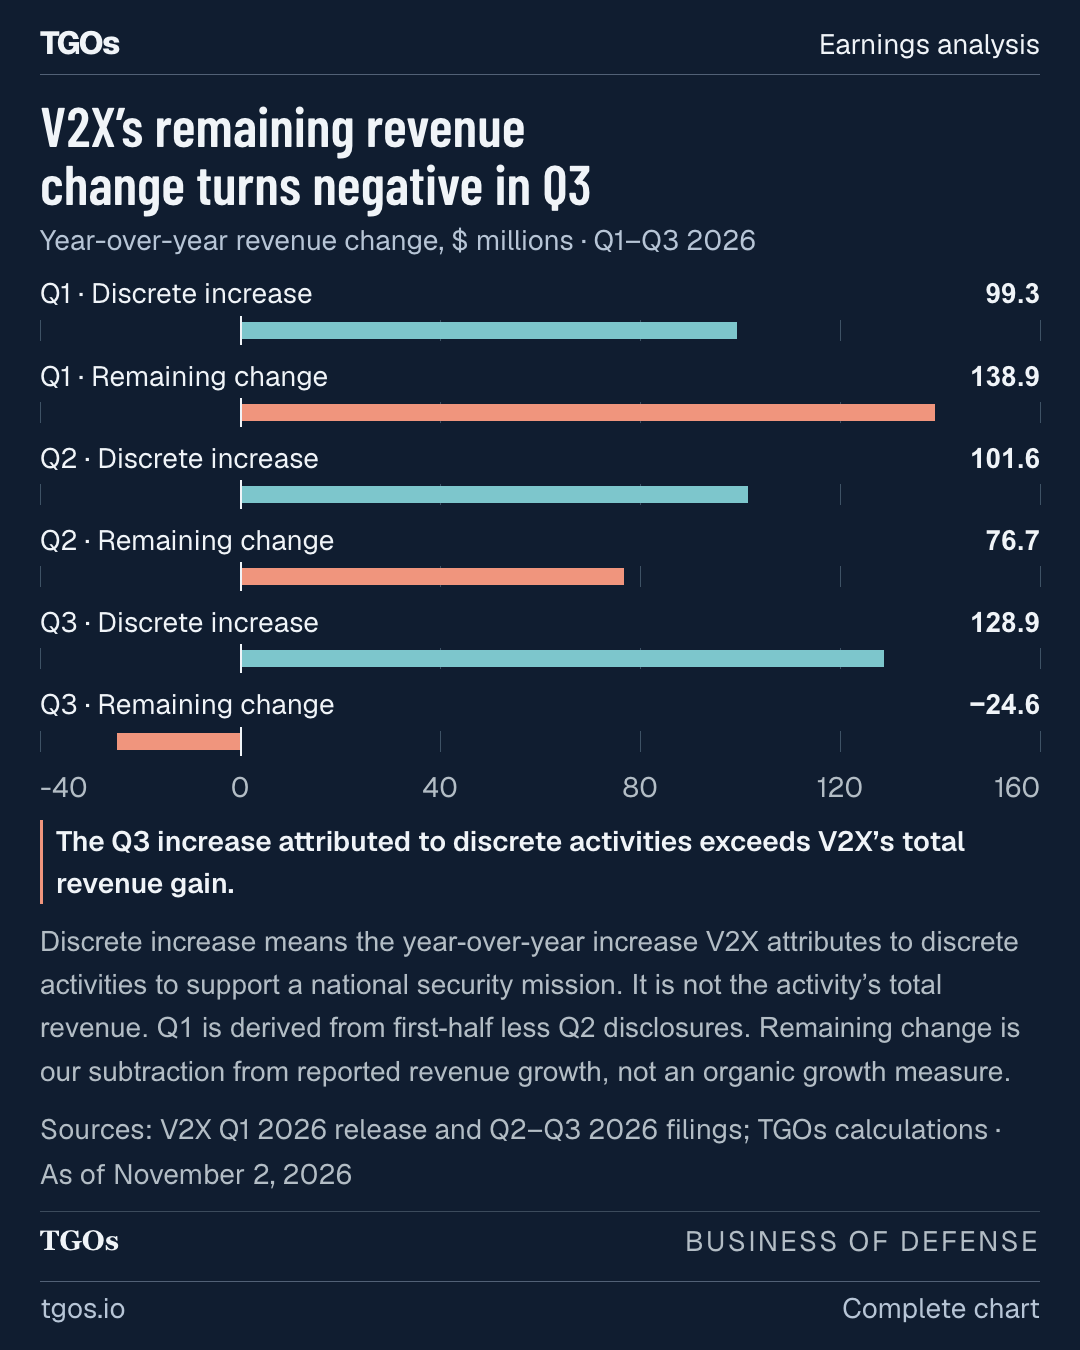
<p>Reported year-over-year revenue growth slowed from 23.4% in the first quarter to 16.5% in the second and 8.9% in the third.<sup class="cite"><a id="ref-source-1-6" href="#src-earnings-vvx-2026-q3-1" role="doc-noteref" aria-label="Source 1">1</a>,<a id="ref-source-4-1" href="#src-earnings-vvx-2026-q3-3" role="doc-noteref" aria-label="Source 3">3</a>,<a id="ref-source-5-1" href="#src-earnings-vvx-2026-q3-4" role="doc-noteref" aria-label="Source 4">4</a></sup> Over the same sequence, the increase attributed to discrete mission activities grew, while the remainder of the revenue change moved from positive to negative.<sup class="cite"><a id="ref-source-1-7" href="#src-earnings-vvx-2026-q3-1" role="doc-noteref" aria-label="Source 1">1</a>,<a id="ref-source-3-3" href="#src-earnings-vvx-2026-q3-2" role="doc-noteref" aria-label="Source 2">2</a>,<a id="ref-source-4-2" href="#src-earnings-vvx-2026-q3-3" role="doc-noteref" aria-label="Source 3">3</a>,<a id="ref-source-5-2" href="#src-earnings-vvx-2026-q3-4" role="doc-noteref" aria-label="Source 4">4</a>,<a id="ref-source-6-1" href="#src-earnings-vvx-2026-q3-5" role="doc-noteref" aria-label="Source 5">5</a></sup></p>
<figure class="gfx peak" id="gfx-growth" aria-labelledby="gfx-title-growth"><h3 id="gfx-title-growth">V2X’s remaining revenue change turns negative in Q3</h3><p class="gfx-subtitle">Year-over-year revenue change, $ millions · Q1–Q3 2026</p><p class="sr-only">V2X’s discrete mission-activity increase rises from $99.3 million in Q1 to $128.9 million in Q3. The remaining revenue change falls from positive $138.9 million to negative $24.6 million.</p><div class="plot"><div class="plot-row"><div class="row-heading"><span>Q1 · Discrete increase</span><strong>99.3</strong></div><div class="track" aria-hidden="true"><span class="gridline" style="left:0.00000%"></span><span class="gridline" style="left:20.00000%"></span><span class="gridline" style="left:40.00000%"></span><span class="gridline" style="left:60.00000%"></span><span class="gridline" style="left:80.00000%"></span><span class="gridline" style="left:100.00000%"></span><span class="zero" style="left:20.00000%"></span><span class="bar a" style="left:20.00000%;width:49.65000%"></span></div></div><div class="plot-row"><div class="row-heading"><span>Q1 · Remaining change</span><strong>138.9</strong></div><div class="track" aria-hidden="true"><span class="gridline" style="left:0.00000%"></span><span class="gridline" style="left:20.00000%"></span><span class="gridline" style="left:40.00000%"></span><span class="gridline" style="left:60.00000%"></span><span class="gridline" style="left:80.00000%"></span><span class="gridline" style="left:100.00000%"></span><span class="zero" style="left:20.00000%"></span><span class="bar b" style="left:20.00000%;width:69.45000%"></span></div></div><div class="plot-row"><div class="row-heading"><span>Q2 · Discrete increase</span><strong>101.6</strong></div><div class="track" aria-hidden="true"><span class="gridline" style="left:0.00000%"></span><span class="gridline" style="left:20.00000%"></span><span class="gridline" style="left:40.00000%"></span><span class="gridline" style="left:60.00000%"></span><span class="gridline" style="left:80.00000%"></span><span class="gridline" style="left:100.00000%"></span><span class="zero" style="left:20.00000%"></span><span class="bar a" style="left:20.00000%;width:50.80000%"></span></div></div><div class="plot-row"><div class="row-heading"><span>Q2 · Remaining change</span><strong>76.7</strong></div><div class="track" aria-hidden="true"><span class="gridline" style="left:0.00000%"></span><span class="gridline" style="left:20.00000%"></span><span class="gridline" style="left:40.00000%"></span><span class="gridline" style="left:60.00000%"></span><span class="gridline" style="left:80.00000%"></span><span class="gridline" style="left:100.00000%"></span><span class="zero" style="left:20.00000%"></span><span class="bar b" style="left:20.00000%;width:38.35000%"></span></div></div><div class="plot-row"><div class="row-heading"><span>Q3 · Discrete increase</span><strong>128.9</strong></div><div class="track" aria-hidden="true"><span class="gridline" style="left:0.00000%"></span><span class="gridline" style="left:20.00000%"></span><span class="gridline" style="left:40.00000%"></span><span class="gridline" style="left:60.00000%"></span><span class="gridline" style="left:80.00000%"></span><span class="gridline" style="left:100.00000%"></span><span class="zero" style="left:20.00000%"></span><span class="bar a" style="left:20.00000%;width:64.45000%"></span></div></div><div class="plot-row"><div class="row-heading"><span>Q3 · Remaining change</span><strong>−24.6</strong></div><div class="track" aria-hidden="true"><span class="gridline" style="left:0.00000%"></span><span class="gridline" style="left:20.00000%"></span><span class="gridline" style="left:40.00000%"></span><span class="gridline" style="left:60.00000%"></span><span class="gridline" style="left:80.00000%"></span><span class="gridline" style="left:100.00000%"></span><span class="zero" style="left:20.00000%"></span><span class="bar b" style="left:7.70000%;width:12.30000%"></span></div></div><div class="axis" aria-hidden="true"><span class="first" style="left:0.00000%">-40</span><span class="" style="left:20.00000%">0</span><span class="" style="left:40.00000%">40</span><span class="" style="left:60.00000%">80</span><span class="" style="left:80.00000%">120</span><span class="last" style="left:100.00000%">160</span></div></div><p class="annotation">The Q3 increase attributed to discrete activities exceeds V2X’s total revenue gain.<sup class="cite"><a id="ref-source-1-8" href="#src-earnings-vvx-2026-q3-1" role="doc-noteref" aria-label="Source 1">1</a>,<a id="ref-source-3-4" href="#src-earnings-vvx-2026-q3-2" role="doc-noteref" aria-label="Source 2">2</a></sup></p><figcaption>Discrete increase means the year-over-year increase V2X attributes to discrete activities to support a national security mission. It is not the activity’s total revenue.<sup class="cite"><a id="ref-source-3-5" href="#src-earnings-vvx-2026-q3-2" role="doc-noteref" aria-label="Source 2">2</a>,<a id="ref-source-6-2" href="#src-earnings-vvx-2026-q3-5" role="doc-noteref" aria-label="Source 5">5</a></sup> Q1 is derived from first-half less Q2 disclosures.<sup class="cite"><a id="ref-source-6-3" href="#src-earnings-vvx-2026-q3-5" role="doc-noteref" aria-label="Source 5">5</a></sup> Remaining change is our subtraction from reported revenue growth, not an organic growth measure.<sup class="cite"><a id="ref-source-1-9" href="#src-earnings-vvx-2026-q3-1" role="doc-noteref" aria-label="Source 1">1</a>,<a id="ref-source-3-6" href="#src-earnings-vvx-2026-q3-2" role="doc-noteref" aria-label="Source 2">2</a>,<a id="ref-source-4-3" href="#src-earnings-vvx-2026-q3-3" role="doc-noteref" aria-label="Source 3">3</a>,<a id="ref-source-5-3" href="#src-earnings-vvx-2026-q3-4" role="doc-noteref" aria-label="Source 4">4</a>,<a id="ref-source-6-4" href="#src-earnings-vvx-2026-q3-5" role="doc-noteref" aria-label="Source 5">5</a></sup></figcaption><p class="source-line">Sources: V2X Q1 2026 release and Q2–Q3 2026 filings; TGOs calculations · As of November 2, 2026<sup class="cite"><a id="ref-source-1-10" href="#src-earnings-vvx-2026-q3-1" role="doc-noteref" aria-label="Source 1">1</a>,<a id="ref-source-3-7" href="#src-earnings-vvx-2026-q3-2" role="doc-noteref" aria-label="Source 2">2</a>,<a id="ref-source-4-4" href="#src-earnings-vvx-2026-q3-3" role="doc-noteref" aria-label="Source 3">3</a>,<a id="ref-source-5-4" href="#src-earnings-vvx-2026-q3-4" role="doc-noteref" aria-label="Source 4">4</a>,<a id="ref-source-6-5" href="#src-earnings-vvx-2026-q3-5" role="doc-noteref" aria-label="Source 5">5</a></sup></p><div class="gfx-footer">TGOs <span>Business of defense</span></div></figure>
<p>The remainder nets together gains and losses across the business. V2X attributed Q3 growth partly to aerospace and modernization program increases, offset in part by reduced Middle East scope.<sup class="cite"><a id="ref-source-3-8" href="#src-earnings-vvx-2026-q3-2" role="doc-noteref" aria-label="Source 2">2</a></sup> For the nine months, removing the disclosed discrete increase still leaves approximately 5.9% growth relative to prior-year revenue.<sup class="cite"><a id="ref-source-1-11" href="#src-earnings-vvx-2026-q3-1" role="doc-noteref" aria-label="Source 1">1</a>,<a id="ref-source-3-9" href="#src-earnings-vvx-2026-q3-2" role="doc-noteref" aria-label="Source 2">2</a></sup></p>
<p>These calculations remove an attributed year-over-year increase, not the activity&#x27;s revenue level.<sup class="cite"><a id="ref-source-1-12" href="#src-earnings-vvx-2026-q3-1" role="doc-noteref" aria-label="Source 1">1</a>,<a id="ref-source-3-10" href="#src-earnings-vvx-2026-q3-2" role="doc-noteref" aria-label="Source 2">2</a></sup> V2X does not disclose whether those activities will continue, and discrete does not establish that they are one-time work.<sup class="cite"><a id="ref-source-3-11" href="#src-earnings-vvx-2026-q3-2" role="doc-noteref" aria-label="Source 2">2</a></sup> We do not treat the remainder as organic growth: V2X acquired a business in Q3 2025 that it described as a specialized intelligence business.<sup class="cite"><a id="ref-source-8-1" href="#src-earnings-vvx-2026-q3-6" role="doc-noteref" aria-label="Source 6">6</a></sup> Its contribution to the 2026 comparison is not disclosed.</p>
<h2 id="section-earnings-vvx-2026-q3-2">Kuwait task-order revenue falls alongside Middle East revenue</h2>
<p>The clearest disclosed source of contraction is the Logistics Civil Augmentation Program V Kuwait task order.<sup class="cite"><a id="ref-source-3-12" href="#src-earnings-vvx-2026-q3-2" role="doc-noteref" aria-label="Source 2">2</a>,<a id="ref-source-6-6" href="#src-earnings-vvx-2026-q3-5" role="doc-noteref" aria-label="Source 5">5</a></sup> In May, the Army notified V2X that it would reduce the task order&#x27;s scope and extend the revised work through December 31, 2026, for $22.6 million.<sup class="cite"><a id="ref-source-3-13" href="#src-earnings-vvx-2026-q3-2" role="doc-noteref" aria-label="Source 2">2</a></sup></p>
<p>Subtracting first-half task-order revenue from the nine-month figures gives the quarterly comparison below.<sup class="cite"><a id="ref-source-3-14" href="#src-earnings-vvx-2026-q3-2" role="doc-noteref" aria-label="Source 2">2</a>,<a id="ref-source-6-7" href="#src-earnings-vvx-2026-q3-5" role="doc-noteref" aria-label="Source 5">5</a></sup> The derived Kuwait decline is equivalent to about 90% of the Middle East revenue reduction.<sup class="cite"><a id="ref-source-1-13" href="#src-earnings-vvx-2026-q3-1" role="doc-noteref" aria-label="Source 1">1</a>,<a id="ref-source-3-15" href="#src-earnings-vvx-2026-q3-2" role="doc-noteref" aria-label="Source 2">2</a>,<a id="ref-source-6-8" href="#src-earnings-vvx-2026-q3-5" role="doc-noteref" aria-label="Source 5">5</a></sup></p>
<figure class="gfx " id="gfx-logcap" aria-labelledby="gfx-title-logcap"><h3 id="gfx-title-logcap">V2X’s Kuwait task-order revenue falls alongside Middle East revenue</h3><p class="gfx-subtitle">Q3 revenue, $ millions · Geographic total and task-order comparison</p><p class="sr-only">V2X Middle East revenue declines from $344.6 million to $240.5 million. Derived LOGCAP Kuwait revenue falls from $104.8 million to $11.5 million.</p><div class="plot"><div class="plot-row"><div class="row-heading"><span>2025 · Middle East total</span><strong>344.6</strong></div><div class="track" aria-hidden="true"><span class="gridline" style="left:0.00000%"></span><span class="gridline" style="left:25.00000%"></span><span class="gridline" style="left:50.00000%"></span><span class="gridline" style="left:75.00000%"></span><span class="gridline" style="left:100.00000%"></span><span class="zero" style="left:0.00000%"></span><span class="bar a" style="left:0.00000%;width:86.15125%"></span></div></div><div class="plot-row"><div class="row-heading"><span>2026 · Middle East total</span><strong>240.5</strong></div><div class="track" aria-hidden="true"><span class="gridline" style="left:0.00000%"></span><span class="gridline" style="left:25.00000%"></span><span class="gridline" style="left:50.00000%"></span><span class="gridline" style="left:75.00000%"></span><span class="gridline" style="left:100.00000%"></span><span class="zero" style="left:0.00000%"></span><span class="bar a" style="left:0.00000%;width:60.13675%"></span></div></div><div class="plot-row"><div class="row-heading"><span>2025 · LOGCAP Kuwait, derived</span><strong>104.8</strong></div><div class="track" aria-hidden="true"><span class="gridline" style="left:0.00000%"></span><span class="gridline" style="left:25.00000%"></span><span class="gridline" style="left:50.00000%"></span><span class="gridline" style="left:75.00000%"></span><span class="gridline" style="left:100.00000%"></span><span class="zero" style="left:0.00000%"></span><span class="bar b" style="left:0.00000%;width:26.20000%"></span></div></div><div class="plot-row"><div class="row-heading"><span>2026 · LOGCAP Kuwait, derived</span><strong>11.5</strong></div><div class="track" aria-hidden="true"><span class="gridline" style="left:0.00000%"></span><span class="gridline" style="left:25.00000%"></span><span class="gridline" style="left:50.00000%"></span><span class="gridline" style="left:75.00000%"></span><span class="gridline" style="left:100.00000%"></span><span class="zero" style="left:0.00000%"></span><span class="bar b" style="left:0.00000%;width:2.87500%"></span></div></div><div class="axis" aria-hidden="true"><span class="first" style="left:0.00000%">0</span><span class="" style="left:25.00000%">100</span><span class="" style="left:50.00000%">200</span><span class="" style="left:75.00000%">300</span><span class="last" style="left:100.00000%">400</span></div></div><p class="annotation">The derived Kuwait decline is equivalent to about 90% of the Middle East decrease.<sup class="cite"><a id="ref-source-1-14" href="#src-earnings-vvx-2026-q3-1" role="doc-noteref" aria-label="Source 1">1</a>,<a id="ref-source-3-16" href="#src-earnings-vvx-2026-q3-2" role="doc-noteref" aria-label="Source 2">2</a>,<a id="ref-source-6-9" href="#src-earnings-vvx-2026-q3-5" role="doc-noteref" aria-label="Source 5">5</a></sup></p><figcaption>LOGCAP means Logistics Civil Augmentation Program.<sup class="cite"><a id="ref-source-3-17" href="#src-earnings-vvx-2026-q3-2" role="doc-noteref" aria-label="Source 2">2</a></sup> Quarterly task-order figures are derived by subtracting first-half revenue from nine-month revenue.<sup class="cite"><a id="ref-source-3-18" href="#src-earnings-vvx-2026-q3-2" role="doc-noteref" aria-label="Source 2">2</a>,<a id="ref-source-6-10" href="#src-earnings-vvx-2026-q3-5" role="doc-noteref" aria-label="Source 5">5</a></sup> This comparison shows the scale of the Kuwait decline; the filings do not explicitly reconcile it to the Middle East total.<sup class="cite"><a id="ref-source-1-15" href="#src-earnings-vvx-2026-q3-1" role="doc-noteref" aria-label="Source 1">1</a>,<a id="ref-source-3-19" href="#src-earnings-vvx-2026-q3-2" role="doc-noteref" aria-label="Source 2">2</a>,<a id="ref-source-6-11" href="#src-earnings-vvx-2026-q3-5" role="doc-noteref" aria-label="Source 5">5</a></sup></figcaption><p class="source-line">Sources: V2X Q3 2026 release and Q2–Q3 2026 filings; TGOs calculations · As of November 2, 2026<sup class="cite"><a id="ref-source-1-16" href="#src-earnings-vvx-2026-q3-1" role="doc-noteref" aria-label="Source 1">1</a>,<a id="ref-source-3-20" href="#src-earnings-vvx-2026-q3-2" role="doc-noteref" aria-label="Source 2">2</a>,<a id="ref-source-6-12" href="#src-earnings-vvx-2026-q3-5" role="doc-noteref" aria-label="Source 5">5</a></sup></p><div class="gfx-footer">TGOs <span>Business of defense</span></div></figure>
<p>Middle East revenue had still been growing in the second quarter, up 1.3% year over year, before contracting in Q3.<sup class="cite"><a id="ref-source-1-17" href="#src-earnings-vvx-2026-q3-1" role="doc-noteref" aria-label="Source 1">1</a>,<a id="ref-source-5-5" href="#src-earnings-vvx-2026-q3-4" role="doc-noteref" aria-label="Source 4">4</a></sup> V2X removed $414.6 million from backlog because of the Kuwait modification in the quarter ended July 3.<sup class="cite"><a id="ref-source-3-21" href="#src-earnings-vvx-2026-q3-2" role="doc-noteref" aria-label="Source 2">2</a></sup></p>
<p>Management does not currently expect the Kuwait reduction to have a material adverse effect on V2X&#x27;s financial condition or results of operations.<sup class="cite"><a id="ref-source-3-22" href="#src-earnings-vvx-2026-q3-2" role="doc-noteref" aria-label="Source 2">2</a></sup> Our calculation isolates the disclosed discrete increase: it exceeded the total Q3 revenue gain, leaving a net decline in the remaining revenue change.<sup class="cite"><a id="ref-source-1-18" href="#src-earnings-vvx-2026-q3-1" role="doc-noteref" aria-label="Source 1">1</a>,<a id="ref-source-3-23" href="#src-earnings-vvx-2026-q3-2" role="doc-noteref" aria-label="Source 2">2</a></sup></p>
<h2 id="section-earnings-vvx-2026-q3-3">The customer mix shifts away from the Army</h2>
<p>Army customer revenue fell 24.8% year over year in Q3, while Air Force revenue rose 50.0%.<sup class="cite"><a id="ref-source-1-19" href="#src-earnings-vvx-2026-q3-1" role="doc-noteref" aria-label="Source 1">1</a></sup> The same pattern held in Q2, when Army revenue fell 7.7% and Air Force revenue rose 99.6%.<sup class="cite"><a id="ref-source-5-6" href="#src-earnings-vvx-2026-q3-4" role="doc-noteref" aria-label="Source 4">4</a></sup></p>
<div class="table-wrap" tabindex="0" role="region" aria-label="Financial comparison table"><table><thead><tr><th scope="col">Customer category</th><th scope="col">Q3 2025 revenue</th><th scope="col">Q3 2026 revenue</th></tr></thead><tbody><tr><th scope="row">Army</th><td>$449.0m</td><td>$337.7m<sup class="cite"><a id="ref-source-1-20" href="#src-earnings-vvx-2026-q3-1" role="doc-noteref" aria-label="Source 1">1</a></sup></td></tr><tr><th scope="row">Navy</th><td>$390.5m</td><td>$389.7m<sup class="cite"><a id="ref-source-1-21" href="#src-earnings-vvx-2026-q3-1" role="doc-noteref" aria-label="Source 1">1</a></sup></td></tr><tr><th scope="row">Air Force</th><td>$167.6m</td><td>$251.3m<sup class="cite"><a id="ref-source-1-22" href="#src-earnings-vvx-2026-q3-1" role="doc-noteref" aria-label="Source 1">1</a></sup></td></tr><tr><th scope="row">Other</th><td>$160.0m</td><td>$292.8m<sup class="cite"><a id="ref-source-1-23" href="#src-earnings-vvx-2026-q3-1" role="doc-noteref" aria-label="Source 1">1</a></sup></td></tr></tbody></table></div>
<p>The table includes all four customer categories V2X discloses.  Army revenue represented 26.6% of Q3 sales, down from 38.5% a year earlier.  Separately, revenue from U.S. programs rose 30.6%, while Asia grew 8.3% and Europe declined 13.9%.<sup class="cite"><a id="ref-source-1-24" href="#src-earnings-vvx-2026-q3-1" role="doc-noteref" aria-label="Source 1">1</a></sup></p>
<p>V2X reports one operating segment, so these customer and geographic splits do not establish separate profit contributions.<sup class="cite"><a id="ref-source-3-24" href="#src-earnings-vvx-2026-q3-2" role="doc-noteref" aria-label="Source 2">2</a></sup></p>
<p>Contract-type disclosures show another change in mix: time-and-materials revenue reached $159.9 million from $28.1 million.  Cost-plus and cost-reimbursable revenue fell 1.4%, and firm-fixed-price revenue fell 4.0%.<sup class="cite"><a id="ref-source-1-25" href="#src-earnings-vvx-2026-q3-1" role="doc-noteref" aria-label="Source 1">1</a></sup></p>
<h2 id="section-earnings-vvx-2026-q3-4">Profit growth trails sales despite sequential margin recovery</h2>
<p>GAAP operating income rose 6.8% to $59.5 million.  Adjusted earnings before interest, taxes, depreciation and amortization rose 4.0% to $88.6 million.  Both grew more slowly than revenue.  GAAP operating margin fell to 4.7% from 4.8%, and adjusted EBITDA margin fell to 7.0% from 7.3%.<sup class="cite"><a id="ref-source-1-26" href="#src-earnings-vvx-2026-q3-1" role="doc-noteref" aria-label="Source 1">1</a></sup></p>
<p>Contract-estimate changes were less favorable: aggregate cumulative adjustments reduced operating income in Q3 2026 after increasing it a year earlier.  That was a $3.6 million adverse swing, though the disclosures do not isolate its contribution to the margin change.<sup class="cite"><a id="ref-source-3-25" href="#src-earnings-vvx-2026-q3-2" role="doc-noteref" aria-label="Source 2">2</a></sup></p>
<p>Within 2026, GAAP margin has recovered as selling, general and administrative expenses consumed a smaller share of sales.<sup class="cite"><a id="ref-source-1-27" href="#src-earnings-vvx-2026-q3-1" role="doc-noteref" aria-label="Source 1">1</a>,<a id="ref-source-4-5" href="#src-earnings-vvx-2026-q3-3" role="doc-noteref" aria-label="Source 3">3</a>,<a id="ref-source-5-7" href="#src-earnings-vvx-2026-q3-4" role="doc-noteref" aria-label="Source 4">4</a></sup></p>
<div class="table-wrap" tabindex="0" role="region" aria-label="Financial comparison table"><table><thead><tr><th scope="col">Measure</th><th scope="col">Q1 2026</th><th scope="col">Q2 2026</th><th scope="col">Q3 2026</th></tr></thead><tbody><tr><th scope="row">GAAP operating margin</th><td>3.5%<sup class="cite"><a id="ref-source-4-6" href="#src-earnings-vvx-2026-q3-3" role="doc-noteref" aria-label="Source 3">3</a></sup></td><td>4.3%<sup class="cite"><a id="ref-source-5-8" href="#src-earnings-vvx-2026-q3-4" role="doc-noteref" aria-label="Source 4">4</a></sup></td><td>4.7%<sup class="cite"><a id="ref-source-1-28" href="#src-earnings-vvx-2026-q3-1" role="doc-noteref" aria-label="Source 1">1</a></sup></td></tr><tr><th scope="row">Adjusted EBITDA margin, non-GAAP</th><td>6.8%<sup class="cite"><a id="ref-source-4-7" href="#src-earnings-vvx-2026-q3-3" role="doc-noteref" aria-label="Source 3">3</a></sup></td><td>7.1%<sup class="cite"><a id="ref-source-5-9" href="#src-earnings-vvx-2026-q3-4" role="doc-noteref" aria-label="Source 4">4</a></sup></td><td>7.0%<sup class="cite"><a id="ref-source-1-29" href="#src-earnings-vvx-2026-q3-1" role="doc-noteref" aria-label="Source 1">1</a></sup></td></tr><tr><th scope="row">SG&amp;A / revenue</th><td>4.9%<sup class="cite"><a id="ref-source-4-8" href="#src-earnings-vvx-2026-q3-3" role="doc-noteref" aria-label="Source 3">3</a></sup></td><td>4.4%<sup class="cite"><a id="ref-source-5-10" href="#src-earnings-vvx-2026-q3-4" role="doc-noteref" aria-label="Source 4">4</a></sup></td><td>3.5%<sup class="cite"><a id="ref-source-1-30" href="#src-earnings-vvx-2026-q3-1" role="doc-noteref" aria-label="Source 1">1</a></sup></td></tr><tr><th scope="row">M&amp;A, integration and related costs</th><td>$13.4m<sup class="cite"><a id="ref-source-4-9" href="#src-earnings-vvx-2026-q3-3" role="doc-noteref" aria-label="Source 3">3</a></sup></td><td>$7.7m<sup class="cite"><a id="ref-source-5-11" href="#src-earnings-vvx-2026-q3-4" role="doc-noteref" aria-label="Source 4">4</a></sup></td><td>$1.2m<sup class="cite"><a id="ref-source-1-31" href="#src-earnings-vvx-2026-q3-1" role="doc-noteref" aria-label="Source 1">1</a></sup></td></tr></tbody></table></div>
<p>M&amp;A, integration and related costs, excluded from adjusted measures, fell through the year, alongside the improvement in GAAP operating margin.  Adjusted EBITDA margins remained within the narrower range shown above.<sup class="cite"><a id="ref-source-1-32" href="#src-earnings-vvx-2026-q3-1" role="doc-noteref" aria-label="Source 1">1</a>,<a id="ref-source-4-10" href="#src-earnings-vvx-2026-q3-3" role="doc-noteref" aria-label="Source 3">3</a>,<a id="ref-source-5-12" href="#src-earnings-vvx-2026-q3-4" role="doc-noteref" aria-label="Source 4">4</a></sup> For the nine months, V2X attributed higher SG&amp;A to revenue-related operating costs, non-recurring integration initiatives and expenses to evaluate potential M&amp;A opportunities.<sup class="cite"><a id="ref-source-3-26" href="#src-earnings-vvx-2026-q3-2" role="doc-noteref" aria-label="Source 2">2</a></sup> The disclosures do not identify those opportunities.</p>
<p>Below operating income, lower net interest expense helped earnings grow faster.  Net interest expense declined by $4.4 million, accounting for approximately 50.5% of the pretax income increase.<sup class="cite"><a id="ref-source-1-33" href="#src-earnings-vvx-2026-q3-1" role="doc-noteref" aria-label="Source 1">1</a></sup> The effective tax rate also fell to 22.9% from 24.9%.<sup class="cite"><a id="ref-source-3-27" href="#src-earnings-vvx-2026-q3-2" role="doc-noteref" aria-label="Source 2">2</a></sup></p>
<p>GAAP net income rose 30.0%, with diluted earnings per share of $1.01 versus $0.77.  Separately, non-GAAP adjusted diluted EPS reached $1.64, compared with $1.37.<sup class="cite"><a id="ref-source-1-34" href="#src-earnings-vvx-2026-q3-1" role="doc-noteref" aria-label="Source 1">1</a></sup> The earnings improvement therefore includes lower net interest expense and a lower effective tax rate, alongside growth in operating profit.<sup class="cite"><a id="ref-source-1-35" href="#src-earnings-vvx-2026-q3-1" role="doc-noteref" aria-label="Source 1">1</a>,<a id="ref-source-3-28" href="#src-earnings-vvx-2026-q3-2" role="doc-noteref" aria-label="Source 2">2</a></sup></p>
<h2 id="section-earnings-vvx-2026-q3-5">Receivables activity separates the two cash measures</h2>
<p>Third-quarter operating cash improved on both bases.  GAAP cash flow reached $67.3 million from $39.4 million, and adjusted operating cash flow rose to $61.8 million from $35.8 million.  The nine-month picture is less straightforward, with GAAP operating cash negative and adjusted operating cash positive.<sup class="cite"><a id="ref-source-1-36" href="#src-earnings-vvx-2026-q3-1" role="doc-noteref" aria-label="Source 1">1</a></sup></p>
<figure class="gfx " id="gfx-cash" aria-labelledby="gfx-title-cash"><h3 id="gfx-title-cash">V2X’s adjusted cash improves while GAAP cash remains negative</h3><p class="gfx-subtitle">Operating cash flow, $ millions · Nine months ended September 26, 2025 and October 2, 2026</p><p class="sr-only">Nine-month GAAP operating cash is negative $41.0 million in 2026, versus negative $27.5 million in 2025. Adjusted operating cash improves from negative $24.1 million to positive $111.5 million.</p><div class="plot"><div class="plot-row"><div class="row-heading"><span>2025 · GAAP</span><strong>−27.5</strong></div><div class="track" aria-hidden="true"><span class="gridline" style="left:0.00000%"></span><span class="gridline" style="left:16.66667%"></span><span class="gridline" style="left:33.33333%"></span><span class="gridline" style="left:50.00000%"></span><span class="gridline" style="left:66.66667%"></span><span class="gridline" style="left:83.33333%"></span><span class="gridline" style="left:100.00000%"></span><span class="zero" style="left:33.33333%"></span><span class="bar a" style="left:21.88167%;width:11.45167%"></span></div></div><div class="plot-row"><div class="row-heading"><span>2025 · Adjusted, non-GAAP</span><strong>−24.1</strong></div><div class="track" aria-hidden="true"><span class="gridline" style="left:0.00000%"></span><span class="gridline" style="left:16.66667%"></span><span class="gridline" style="left:33.33333%"></span><span class="gridline" style="left:50.00000%"></span><span class="gridline" style="left:66.66667%"></span><span class="gridline" style="left:83.33333%"></span><span class="gridline" style="left:100.00000%"></span><span class="zero" style="left:33.33333%"></span><span class="bar b" style="left:23.30667%;width:10.02667%"></span></div></div><div class="plot-row"><div class="row-heading"><span>2026 · GAAP</span><strong>−41.0</strong></div><div class="track" aria-hidden="true"><span class="gridline" style="left:0.00000%"></span><span class="gridline" style="left:16.66667%"></span><span class="gridline" style="left:33.33333%"></span><span class="gridline" style="left:50.00000%"></span><span class="gridline" style="left:66.66667%"></span><span class="gridline" style="left:83.33333%"></span><span class="gridline" style="left:100.00000%"></span><span class="zero" style="left:33.33333%"></span><span class="bar a" style="left:16.23292%;width:17.10042%"></span></div></div><div class="plot-row"><div class="row-heading"><span>2026 · Adjusted, non-GAAP</span><strong>111.5</strong></div><div class="track" aria-hidden="true"><span class="gridline" style="left:0.00000%"></span><span class="gridline" style="left:16.66667%"></span><span class="gridline" style="left:33.33333%"></span><span class="gridline" style="left:50.00000%"></span><span class="gridline" style="left:66.66667%"></span><span class="gridline" style="left:83.33333%"></span><span class="gridline" style="left:100.00000%"></span><span class="zero" style="left:33.33333%"></span><span class="bar b" style="left:33.33333%;width:46.47417%"></span></div></div><div class="axis" aria-hidden="true"><span class="first" style="left:0.00000%">-80</span><span class="" style="left:16.66667%">-40</span><span class="" style="left:33.33333%">0</span><span class="" style="left:50.00000%">40</span><span class="" style="left:66.66667%">80</span><span class="" style="left:83.33333%">120</span><span class="last" style="left:100.00000%">160</span></div></div><p class="annotation">The release adds back $141.1 million of MARPA facility activity in 2026.<sup class="cite"><a id="ref-source-1-37" href="#src-earnings-vvx-2026-q3-1" role="doc-noteref" aria-label="Source 1">1</a></sup></p><figcaption>Adjusted operating cash excludes MARPA receivables-facility activity and M&amp;A, integration and related payments; it is not free cash flow.<sup class="cite"><a id="ref-source-1-38" href="#src-earnings-vvx-2026-q3-1" role="doc-noteref" aria-label="Source 1">1</a></sup> The release’s MARPA adjustment differs from the filing’s net outflow excluding fees, which is $133.0 million; the documents do not reconcile them.<sup class="cite"><a id="ref-source-1-39" href="#src-earnings-vvx-2026-q3-1" role="doc-noteref" aria-label="Source 1">1</a>,<a id="ref-source-3-29" href="#src-earnings-vvx-2026-q3-2" role="doc-noteref" aria-label="Source 2">2</a></sup></figcaption><p class="source-line">Sources: V2X Q3 2026 release and filing · As of November 2, 2026<sup class="cite"><a id="ref-source-1-40" href="#src-earnings-vvx-2026-q3-1" role="doc-noteref" aria-label="Source 1">1</a>,<a id="ref-source-3-30" href="#src-earnings-vvx-2026-q3-2" role="doc-noteref" aria-label="Source 2">2</a></sup></p><div class="gfx-footer">TGOs <span>Business of defense</span></div></figure>
<p>The release&#x27;s MARPA facility adjustment accounts for 92.5% of the nine-month gap between GAAP and adjusted operating cash flow.  M&amp;A, integration and related payments account for the remainder, apart from a small printed discrepancy.<sup class="cite"><a id="ref-source-1-41" href="#src-earnings-vvx-2026-q3-1" role="doc-noteref" aria-label="Source 1">1</a></sup></p>
<p>The 10-Q describes net cash outflows from receivable sales through the MARPA facility of $133.0 million, plus $83.2 million of working-capital outflows.<sup class="cite"><a id="ref-source-3-31" href="#src-earnings-vvx-2026-q3-2" role="doc-noteref" aria-label="Source 2">2</a></sup> Those receivable-sale outflows reduced reported operating cash; the adjusted measure excludes MARPA facility activity.<sup class="cite"><a id="ref-source-1-42" href="#src-earnings-vvx-2026-q3-1" role="doc-noteref" aria-label="Source 1">1</a>,<a id="ref-source-3-32" href="#src-earnings-vvx-2026-q3-2" role="doc-noteref" aria-label="Source 2">2</a></sup></p>
<p>The two disclosures use different MARPA measures. The release&#x27;s facility-activity adjustment exceeds the 10-Q&#x27;s net outflow excluding fees by $8.1 million, without a reconciliation.  For nine months 2025, the release lists a negative $8.6 million adjustment, while the 10-Q reports $17.0 million of net proceeds.<sup class="cite"><a id="ref-source-1-43" href="#src-earnings-vvx-2026-q3-1" role="doc-noteref" aria-label="Source 1">1</a>,<a id="ref-source-3-33" href="#src-earnings-vvx-2026-q3-2" role="doc-noteref" aria-label="Source 2">2</a></sup> We keep those measures distinct.</p>
<p>The release&#x27;s MARPA adjustment was concentrated in the first half; its Q3 adjustment was negative, meaning the facility activity helped GAAP operating cash that quarter.<sup class="cite"><a id="ref-source-1-44" href="#src-earnings-vvx-2026-q3-1" role="doc-noteref" aria-label="Source 1">1</a>,<a id="ref-source-5-13" href="#src-earnings-vvx-2026-q3-4" role="doc-noteref" aria-label="Source 4">4</a></sup> Both years in the chart use the Q3 2026 release&#x27;s adjusted-cash comparison, including its exclusions for MARPA activity and M&amp;A-related payments.<sup class="cite"><a id="ref-source-1-45" href="#src-earnings-vvx-2026-q3-1" role="doc-noteref" aria-label="Source 1">1</a></sup></p>
<p>Adjusted operating cash is not free cash flow. Capital-asset purchases used $6.7 million in the first nine months, versus $9.7 million a year earlier.  The cash-flow statement&#x27;s nine-month GAAP figure differs from the release&#x27;s non-GAAP reconciliation by $1,000, with no effect at the displayed precision.<sup class="cite"><a id="ref-source-1-46" href="#src-earnings-vvx-2026-q3-1" role="doc-noteref" aria-label="Source 1">1</a></sup></p>
<h2 id="section-earnings-vvx-2026-q3-6">Debt falls in Q3 but remains above year-end</h2>
<p>V2X ended Q3 with $811.7 million of net debt and net leverage of 2.2 times trailing bank EBITDA, both company-defined non-GAAP measures.<sup class="cite"><a id="ref-source-1-47" href="#src-earnings-vvx-2026-q3-1" role="doc-noteref" aria-label="Source 1">1</a></sup> Net debt fell $64.4 million from Q2 but remained $53.9 million above December 31, 2025.<sup class="cite"><a id="ref-source-1-48" href="#src-earnings-vvx-2026-q3-1" role="doc-noteref" aria-label="Source 1">1</a>,<a id="ref-source-5-14" href="#src-earnings-vvx-2026-q3-4" role="doc-noteref" aria-label="Source 4">4</a>,<a id="ref-source-7-1" href="#src-earnings-vvx-2026-q3-7" role="doc-noteref" aria-label="Source 7">7</a></sup> V2X reported a $140.3 million improvement in net debt from a year earlier.<sup class="cite"><a id="ref-source-1-49" href="#src-earnings-vvx-2026-q3-1" role="doc-noteref" aria-label="Source 1">1</a></sup></p>
<p>Cash, cash equivalents and restricted cash declined $103.9 million from year-end.  Long-term debt repayments used $51.0 million during the nine months, while V2X made no share repurchases, compared with $10.0 million a year earlier.<sup class="cite"><a id="ref-source-1-50" href="#src-earnings-vvx-2026-q3-1" role="doc-noteref" aria-label="Source 1">1</a></sup></p>
<p>The year-end leverage forecast is also less demanding than the May wording: V2X expects approximately 2.0 times, compared with less than 2.0 times in its Q1 release.<sup class="cite"><a id="ref-source-1-51" href="#src-earnings-vvx-2026-q3-1" role="doc-noteref" aria-label="Source 1">1</a>,<a id="ref-source-4-11" href="#src-earnings-vvx-2026-q3-3" role="doc-noteref" aria-label="Source 3">3</a></sup></p>
<h2 id="section-earnings-vvx-2026-q3-7">Most of the backlog increase is unfunded</h2>
<p>Total backlog grew 10.5% from a year earlier, while funded backlog grew 13.7%.<sup class="cite"><a id="ref-source-3-34" href="#src-earnings-vvx-2026-q3-2" role="doc-noteref" aria-label="Source 2">2</a>,<a id="ref-source-9-1" href="#src-earnings-vvx-2026-q3-8" role="doc-noteref" aria-label="Source 8">8</a></sup></p>
<div class="table-wrap" tabindex="0" role="region" aria-label="Financial comparison table"><table><thead><tr><th scope="col">Backlog, $ millions</th><th scope="col">September 26, 2025</th><th scope="col">December 31, 2025</th><th scope="col">July 3, 2026</th><th scope="col">October 2, 2026</th></tr></thead><tbody><tr><th scope="row">Total</th><td>11,574<sup class="cite"><a id="ref-source-9-2" href="#src-earnings-vvx-2026-q3-8" role="doc-noteref" aria-label="Source 8">8</a></sup></td><td>11,116<sup class="cite"><a id="ref-source-3-35" href="#src-earnings-vvx-2026-q3-2" role="doc-noteref" aria-label="Source 2">2</a></sup></td><td>12,727<sup class="cite"><a id="ref-source-6-13" href="#src-earnings-vvx-2026-q3-5" role="doc-noteref" aria-label="Source 5">5</a></sup></td><td>12,787<sup class="cite"><a id="ref-source-3-36" href="#src-earnings-vvx-2026-q3-2" role="doc-noteref" aria-label="Source 2">2</a></sup></td></tr><tr><th scope="row">Funded</th><td>2,279<sup class="cite"><a id="ref-source-9-3" href="#src-earnings-vvx-2026-q3-8" role="doc-noteref" aria-label="Source 8">8</a></sup></td><td>2,303<sup class="cite"><a id="ref-source-3-37" href="#src-earnings-vvx-2026-q3-2" role="doc-noteref" aria-label="Source 2">2</a></sup></td><td>2,520<sup class="cite"><a id="ref-source-6-14" href="#src-earnings-vvx-2026-q3-5" role="doc-noteref" aria-label="Source 5">5</a></sup></td><td>2,591<sup class="cite"><a id="ref-source-3-38" href="#src-earnings-vvx-2026-q3-2" role="doc-noteref" aria-label="Source 2">2</a></sup></td></tr></tbody></table></div>
<p>Since year-end, unfunded backlog increased $1,383 million, compared with $288 million for funded backlog.  Unfunded backlog includes probable unexercised options and excludes potential orders under indefinite-delivery, indefinite-quantity contracts.  Its growth therefore does not establish an equivalent increase in funded work.<sup class="cite"><a id="ref-source-3-39" href="#src-earnings-vvx-2026-q3-2" role="doc-noteref" aria-label="Source 2">2</a></sup></p>
<p>Bookings have varied sharply. Approximate book-to-bill moved from 0.7 times in Q4 2025 to 3.2 times in Q1 2026, then 0.5 times in Q2 and 1.2 times in Q3.<sup class="cite"><a id="ref-source-1-52" href="#src-earnings-vvx-2026-q3-1" role="doc-noteref" aria-label="Source 1">1</a>,<a id="ref-source-4-12" href="#src-earnings-vvx-2026-q3-3" role="doc-noteref" aria-label="Source 3">3</a>,<a id="ref-source-5-15" href="#src-earnings-vvx-2026-q3-4" role="doc-noteref" aria-label="Source 4">4</a>,<a id="ref-source-7-2" href="#src-earnings-vvx-2026-q3-7" role="doc-noteref" aria-label="Source 7">7</a></sup> The Q2 comparison coincided with the LOGCAP Kuwait backlog removal.<sup class="cite"><a id="ref-source-3-40" href="#src-earnings-vvx-2026-q3-2" role="doc-noteref" aria-label="Source 2">2</a>,<a id="ref-source-5-16" href="#src-earnings-vvx-2026-q3-4" role="doc-noteref" aria-label="Source 4">4</a></sup></p>
<p>Total backlog rose only $60 million during Q3 despite book-to-bill above one.<sup class="cite"><a id="ref-source-1-53" href="#src-earnings-vvx-2026-q3-1" role="doc-noteref" aria-label="Source 1">1</a>,<a id="ref-source-3-41" href="#src-earnings-vvx-2026-q3-2" role="doc-noteref" aria-label="Source 2">2</a>,<a id="ref-source-6-15" href="#src-earnings-vvx-2026-q3-5" role="doc-noteref" aria-label="Source 5">5</a></sup> Approximate ratios and the absence of a complete backlog roll-forward prevent a reconciliation; we do not turn those ratios into precise bookings dollars.</p>
<p>V2X received $4.1 billion in funded orders during the nine months, up $0.8 billion.<sup class="cite"><a id="ref-source-3-42" href="#src-earnings-vvx-2026-q3-2" role="doc-noteref" aria-label="Source 2">2</a></sup> Funding received, backlog and revenue recognized describe different stages of the business; the rounded orders figure does not reconcile the backlog movement.</p>
<h2 id="section-earnings-vvx-2026-q3-8">Higher guidance still permits a Q4 revenue decline</h2>
<p>V2X raised its full-year revenue range again in November.<sup class="cite"><a id="ref-source-1-54" href="#src-earnings-vvx-2026-q3-1" role="doc-noteref" aria-label="Source 1">1</a></sup> The low end is $275 million above the initial February forecast.<sup class="cite"><a id="ref-source-1-55" href="#src-earnings-vvx-2026-q3-1" role="doc-noteref" aria-label="Source 1">1</a>,<a id="ref-source-7-3" href="#src-earnings-vvx-2026-q3-7" role="doc-noteref" aria-label="Source 7">7</a></sup> President and Chief Executive Officer Jeremy C. Wensinger attributed the November 2 increase to year-to-date performance, the backlog position and existing demand signals.<sup class="cite"><a id="ref-source-1-56" href="#src-earnings-vvx-2026-q3-1" role="doc-noteref" aria-label="Source 1">1</a></sup></p>
<figure class="gfx " id="gfx-guidance" aria-labelledby="gfx-title-guidance"><h3 id="gfx-title-guidance">V2X raises its revenue forecast through 2026</h3><p class="gfx-subtitle">Full-year revenue ranges, $ millions · Forecasts, with FY2025 actual as a reference</p><p class="sr-only">V2X full-year 2026 revenue guidance rises from $4,675–$4,825 million in February to $4,950–$5,100 million in November. FY2025 actual revenue was $4,480.0 million.</p><div class="plot"><div class="plot-row"><div class="row-heading"><span>February 23 forecast</span><strong>4,675–4,825</strong></div><div class="track" aria-hidden="true"><span class="gridline" style="left:0.00000%"></span><span class="gridline" style="left:25.00000%"></span><span class="gridline" style="left:50.00000%"></span><span class="gridline" style="left:75.00000%"></span><span class="gridline" style="left:100.00000%"></span><span class="forecast" style="left:34.37500%;width:18.75000%"></span></div></div><div class="plot-row"><div class="row-heading"><span>May 4 forecast</span><strong>4,825–4,975</strong></div><div class="track" aria-hidden="true"><span class="gridline" style="left:0.00000%"></span><span class="gridline" style="left:25.00000%"></span><span class="gridline" style="left:50.00000%"></span><span class="gridline" style="left:75.00000%"></span><span class="gridline" style="left:100.00000%"></span><span class="forecast" style="left:53.12500%;width:18.75000%"></span></div></div><div class="plot-row"><div class="row-heading"><span>August 3 forecast</span><strong>4,875–5,025</strong></div><div class="track" aria-hidden="true"><span class="gridline" style="left:0.00000%"></span><span class="gridline" style="left:25.00000%"></span><span class="gridline" style="left:50.00000%"></span><span class="gridline" style="left:75.00000%"></span><span class="gridline" style="left:100.00000%"></span><span class="forecast" style="left:59.37500%;width:18.75000%"></span></div></div><div class="plot-row"><div class="row-heading"><span>November 2 forecast</span><strong>4,950–5,100</strong></div><div class="track" aria-hidden="true"><span class="gridline" style="left:0.00000%"></span><span class="gridline" style="left:25.00000%"></span><span class="gridline" style="left:50.00000%"></span><span class="gridline" style="left:75.00000%"></span><span class="gridline" style="left:100.00000%"></span><span class="forecast" style="left:68.75000%;width:18.75000%"></span></div></div><div class="plot-row"><div class="row-heading"><span>FY2025 actual</span><strong>4,480.0</strong></div><div class="track" aria-hidden="true"><span class="gridline" style="left:0.00000%"></span><span class="gridline" style="left:25.00000%"></span><span class="gridline" style="left:50.00000%"></span><span class="gridline" style="left:75.00000%"></span><span class="gridline" style="left:100.00000%"></span><span class="point" style="left:10.00475%"></span></div></div><div class="axis" aria-hidden="true"><span class="first" style="left:0.00000%">4,400</span><span class="" style="left:25.00000%">4,600</span><span class="" style="left:50.00000%">4,800</span><span class="" style="left:75.00000%">5,000</span><span class="last" style="left:100.00000%">5,200</span></div></div><p class="annotation">The November low end is $75 million above August.<sup class="cite"><a id="ref-source-1-57" href="#src-earnings-vvx-2026-q3-1" role="doc-noteref" aria-label="Source 1">1</a></sup></p><figcaption>Outlined intervals are company forecasts; the dot is reported FY2025 revenue. The axis begins at $4,400 million to compare range positions, not bar lengths from zero.<sup class="cite"><a id="ref-source-1-58" href="#src-earnings-vvx-2026-q3-1" role="doc-noteref" aria-label="Source 1">1</a>,<a id="ref-source-4-13" href="#src-earnings-vvx-2026-q3-3" role="doc-noteref" aria-label="Source 3">3</a>,<a id="ref-source-5-17" href="#src-earnings-vvx-2026-q3-4" role="doc-noteref" aria-label="Source 4">4</a>,<a id="ref-source-7-4" href="#src-earnings-vvx-2026-q3-7" role="doc-noteref" aria-label="Source 7">7</a></sup></figcaption><p class="source-line">Sources: V2X FY2025 and Q1–Q3 2026 earnings releases · As of November 2, 2026<sup class="cite"><a id="ref-source-1-59" href="#src-earnings-vvx-2026-q3-1" role="doc-noteref" aria-label="Source 1">1</a>,<a id="ref-source-4-14" href="#src-earnings-vvx-2026-q3-3" role="doc-noteref" aria-label="Source 3">3</a>,<a id="ref-source-5-18" href="#src-earnings-vvx-2026-q3-4" role="doc-noteref" aria-label="Source 4">4</a>,<a id="ref-source-7-5" href="#src-earnings-vvx-2026-q3-7" role="doc-noteref" aria-label="Source 7">7</a></sup></p><div class="gfx-footer">TGOs <span>Business of defense</span></div></figure>
<p>V2X also raised its full-year non-GAAP forecasts for adjusted EBITDA, adjusted diluted EPS and adjusted operating cash flow.  Subtracting nine-month actuals gives the approximate Q4 amounts below; these are our calculations, not company-issued quarterly guidance.<sup class="cite"><a id="ref-source-1-60" href="#src-earnings-vvx-2026-q3-1" role="doc-noteref" aria-label="Source 1">1</a></sup></p>
<div class="table-wrap" tabindex="0" role="region" aria-label="Financial comparison table"><table><thead><tr><th scope="col">Measure</th><th scope="col">Full-year 2026 forecast</th><th scope="col">Approximate Q4 remainder</th><th scope="col">Q4 2025 actual</th></tr></thead><tbody><tr><th scope="row">Revenue, $m</th><td>4,950–5,100<sup class="cite"><a id="ref-source-1-61" href="#src-earnings-vvx-2026-q3-1" role="doc-noteref" aria-label="Source 1">1</a></sup></td><td>1,168–1,318<sup class="cite"><a id="ref-source-1-62" href="#src-earnings-vvx-2026-q3-1" role="doc-noteref" aria-label="Source 1">1</a></sup></td><td>1,219<sup class="cite"><a id="ref-source-7-6" href="#src-earnings-vvx-2026-q3-7" role="doc-noteref" aria-label="Source 7">7</a></sup></td></tr><tr><th scope="row">Adjusted EBITDA, $m</th><td>352.5–367.5<sup class="cite"><a id="ref-source-1-63" href="#src-earnings-vvx-2026-q3-1" role="doc-noteref" aria-label="Source 1">1</a></sup></td><td>88.5–103.5<sup class="cite"><a id="ref-source-1-64" href="#src-earnings-vvx-2026-q3-1" role="doc-noteref" aria-label="Source 1">1</a></sup></td><td>88.7<sup class="cite"><a id="ref-source-7-7" href="#src-earnings-vvx-2026-q3-7" role="doc-noteref" aria-label="Source 7">7</a></sup></td></tr><tr><th scope="row">Adjusted diluted EPS, $</th><td>6.15–6.55<sup class="cite"><a id="ref-source-1-65" href="#src-earnings-vvx-2026-q3-1" role="doc-noteref" aria-label="Source 1">1</a></sup></td><td>1.35–1.75<sup class="cite"><a id="ref-source-1-66" href="#src-earnings-vvx-2026-q3-1" role="doc-noteref" aria-label="Source 1">1</a></sup></td><td>1.56<sup class="cite"><a id="ref-source-7-8" href="#src-earnings-vvx-2026-q3-7" role="doc-noteref" aria-label="Source 7">7</a></sup></td></tr><tr><th scope="row">Adjusted operating cash flow, $m</th><td>175–195<sup class="cite"><a id="ref-source-1-67" href="#src-earnings-vvx-2026-q3-1" role="doc-noteref" aria-label="Source 1">1</a></sup></td><td>63.5–83.5<sup class="cite"><a id="ref-source-1-68" href="#src-earnings-vvx-2026-q3-1" role="doc-noteref" aria-label="Source 1">1</a></sup></td><td>172.4<sup class="cite"><a id="ref-source-7-9" href="#src-earnings-vvx-2026-q3-7" role="doc-noteref" aria-label="Source 7">7</a></sup></td></tr></tbody></table></div>
<p>The revenue remainder allows anything from an approximate 4% decline to an 8% increase against Q4 2025.<sup class="cite"><a id="ref-source-1-69" href="#src-earnings-vvx-2026-q3-1" role="doc-noteref" aria-label="Source 1">1</a>,<a id="ref-source-7-10" href="#src-earnings-vvx-2026-q3-7" role="doc-noteref" aria-label="Source 7">7</a></sup> Dollar guidance is rounded, so those growth endpoints are approximate; the EPS subtraction also depends on differing share counts.<sup class="cite"><a id="ref-source-1-70" href="#src-earnings-vvx-2026-q3-1" role="doc-noteref" aria-label="Source 1">1</a></sup></p>
<p>The adjusted-cash remainder is well below last year&#x27;s fourth quarter, following stronger nine-month adjusted cash generation.<sup class="cite"><a id="ref-source-1-71" href="#src-earnings-vvx-2026-q3-1" role="doc-noteref" aria-label="Source 1">1</a>,<a id="ref-source-7-11" href="#src-earnings-vvx-2026-q3-7" role="doc-noteref" aria-label="Source 7">7</a></sup> The releases do not explain the expected cadence. Last year&#x27;s fourth quarter generated more adjusted operating cash than the full year, illustrating how much the timing can matter.<sup class="cite"><a id="ref-source-7-12" href="#src-earnings-vvx-2026-q3-7" role="doc-noteref" aria-label="Source 7">7</a></sup></p>
<p>The disclosed Kuwait extension keeps that task order at reduced scope through year-end.<sup class="cite"><a id="ref-source-3-43" href="#src-earnings-vvx-2026-q3-2" role="doc-noteref" aria-label="Source 2">2</a></sup> V2X does not disclose whether guidance assumes continued increases from the discrete mission activities.<sup class="cite"><a id="ref-source-1-72" href="#src-earnings-vvx-2026-q3-1" role="doc-noteref" aria-label="Source 1">1</a>,<a id="ref-source-3-44" href="#src-earnings-vvx-2026-q3-2" role="doc-noteref" aria-label="Source 2">2</a></sup> That leaves the durability of the reported revenue growth unresolved, even as the higher forecast and funded backlog show progress on different measures.<sup class="cite"><a id="ref-source-1-73" href="#src-earnings-vvx-2026-q3-1" role="doc-noteref" aria-label="Source 1">1</a>,<a id="ref-source-3-45" href="#src-earnings-vvx-2026-q3-2" role="doc-noteref" aria-label="Source 2">2</a>,<a id="ref-source-9-4" href="#src-earnings-vvx-2026-q3-8" role="doc-noteref" aria-label="Source 8">8</a></sup></p></article><section class="sources" aria-labelledby="sources-heading"></section><footer class="endmark">TGOs · Where the money’s going, who’s buying whom, and what it means for the mission.</footer><details class="srcs" open><summary>Sources (8)</summary><ol><li id="src-earnings-vvx-2026-q3-1"><a href="https://www.sec.gov/Archives/edgar/data/1601548/000160154826000050/v2xq32026pressreleasefin.htm" rel=noopener>V2X Q3 2026 earnings release, SEC Exhibit 99.1, November 2, 2026</a></li><li id="src-earnings-vvx-2026-q3-2"><a href="https://www.sec.gov/Archives/edgar/data/1601548/000160154826000049/vec-20261002.htm" rel=noopener>V2X Form 10-Q, quarter ended October 2, 2026</a></li><li id="src-earnings-vvx-2026-q3-3"><a href="https://www.sec.gov/Archives/edgar/data/1601548/000160154826000026/v2xq12026pressreleasevf.htm" rel=noopener>V2X Q1 2026 earnings release, SEC Exhibit 99.1, May 4, 2026</a></li><li id="src-earnings-vvx-2026-q3-4"><a href="https://www.sec.gov/Archives/edgar/data/1601548/000160154826000039/a2q2026pressreleasefinal.htm" rel=noopener>V2X Q2 2026 earnings release, SEC Exhibit 99.1, August 3, 2026</a></li><li id="src-earnings-vvx-2026-q3-5"><a href="https://www.sec.gov/Archives/edgar/data/1601548/000160154826000038/vec-20260703.htm" rel=noopener>V2X Form 10-Q, quarter ended July 3, 2026</a></li><li id="src-earnings-vvx-2026-q3-6"><a href="https://www.sec.gov/Archives/edgar/data/1601548/000160154825000068/q32025pressrelease_vf.htm" rel=noopener>V2X Q3 2025 earnings release, SEC Exhibit 99.1, November 3, 2025</a></li><li id="src-earnings-vvx-2026-q3-7"><a href="https://www.sec.gov/Archives/edgar/data/1601548/000160154826000016/v2xq42025pressreleasevf.htm" rel=noopener>V2X Q4 and full-year 2025 earnings release, SEC Exhibit 99.1, February 23, 2026</a></li><li id="src-earnings-vvx-2026-q3-8"><a href="https://www.sec.gov/Archives/edgar/data/1601548/000160154825000066/vec-20250926.htm" rel=noopener>V2X Form 10-Q, quarter ended September 26, 2025</a></li></ol></details><section class="chart-downloads"><h2>Take the chart with you</h2><ul><li><a href="/earnings/vvx-2026-q3/analysis/share.png" download>Share chart</a></li></ul></section></article><section class="connected-reporting"><h2>Follow the reporting</h2><ul class="cards"><li class="card"><a href="/news/2026/11/02/v2x-raises-its-adjusted-cash-forecast/"><span class="k">Brief</span><b>V2X raises its adjusted cash forecast</b><span class="d">Revenue rose 9% in the third quarter, while nine-month operating cash flow was negative. V2X&#x27;s higher cash forecast uses an adjusted measure.</span><time datetime="2026-11-02">Nov 2, 2026</time></a></li></ul><p><a href="/earnings/vvx-2026-q3/">V2X · Q3 2026: earnings and company materials ↗</a></p></section>