Earnings analysis
CACI raises its organic growth outlook
Margins improved in the September quarter, but organic growth slowed. CACI's higher revenue outlook requires faster growth while interest absorbs much of the operating gain.
In this analysis
Analysis of CACI’s earnings releases, SEC filings and official presentation slides. Spoken call remarks and analyst Q&A are outside this analysis.
CACI lifted its organic growth forecast after a quarter in which organic growth slowed and profitability improved. 1, 2, 3, 4 September-quarter revenue rose 8.2% to $2,474.6 million, including 2.1% organic growth. Reported growth exceeded organic growth by about 6.1 percentage points, a difference calculated from rounded rates. 1 The filing attributes revenue growth to acquisitions and organic growth. 5
The quarter gives the higher forecast stronger margins and more funded backlog to build on. 1 It also leaves a higher growth requirement for the remaining nine months, while interest expense limits how much operating improvement reaches shareholders. 1, 5, 4, 6, 7
The outlook covers the twelve months through June 2027, using the period CACI called fiscal 2027 in its October release. 1, 4 That period needs care: CACI has changed its fiscal year-end to December. 8 It plans a July–December 2026 transition report and expects replacement guidance with December-quarter results in February 2027. 2, 8
Margin improves as organic growth slows
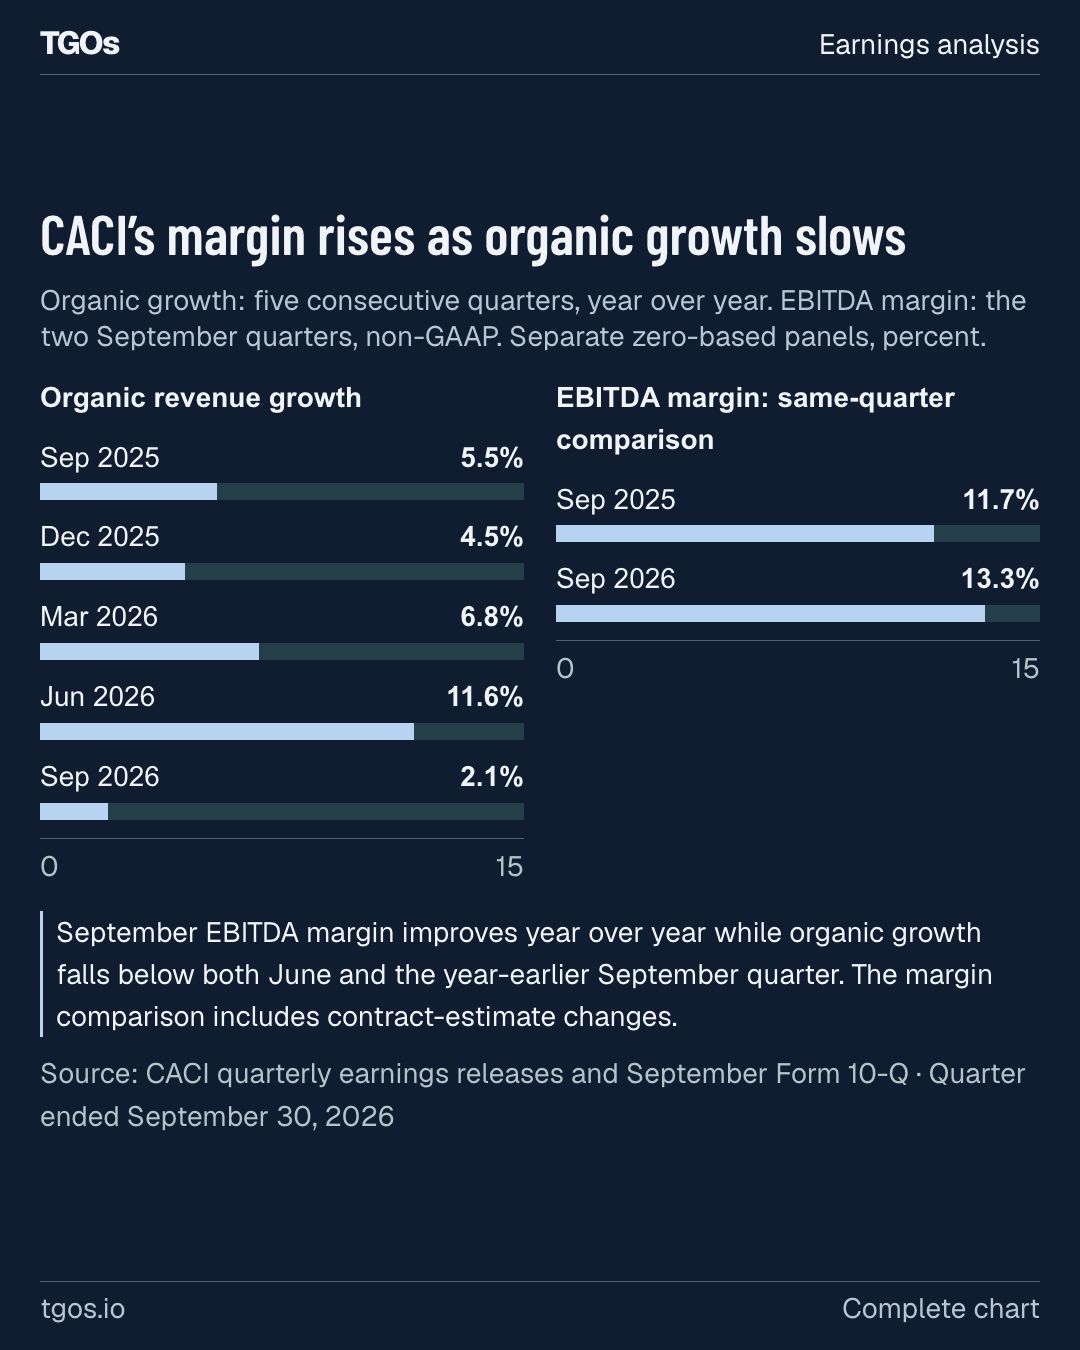
Organic growth fell from the June quarter and from the comparable September quarter a year earlier. 1, 4, 9 CACI's presentation describes the latest result as in line with expectations; the release and filing do not explain the slower rate. 1, 5, 2
CACI’s margin rises as organic growth slows
Organic growth: five consecutive quarters, year over year. EBITDA margin: the two September quarters, non-GAAP. Separate zero-based panels, percent.
CACI’s margin rises as organic growth slows. Organic revenue growth: Sep 2025, 5.5%; Dec 2025, 4.5%; Mar 2026, 6.8%; Jun 2026, 11.6%; Sep 2026, 2.1%. EBITDA margin: same-quarter comparison: Sep 2025, 11.7%; Sep 2026, 13.3%.
Organic revenue growth
EBITDA margin: same-quarter comparison
September EBITDA margin improves year over year while organic growth falls below both June and the year-earlier September quarter. The margin comparison includes contract-estimate changes.
Source: CACI quarterly earnings releases and September Form 10-Q · Quarter ended September 30, 2026 1, 5, 4, 6, 7, 9
The sequential revenue comparison also weakened. Revenue fell 8.7% from the June quarter, compared with a 0.7% decline across the same transition a year earlier. The comparison establishes the change, without identifying its cause. 1, 4
Profitability moved in the other direction. 1 CACI's September EBITDA margin exceeded the mid-11% range it had forecast in August, and its presentation credits execution and favorable mix. 1, 2, 3 EBITDA is earnings before interest, taxes, depreciation and amortization, a non-GAAP measure. 1
CACI attributes the decline in direct costs, from 67.6% to 64.6% of revenue, to a favorable revenue mix. Indirect costs and selling expenses rose to 22.2% from 20.7%, partly offsetting that improvement. 5
Contract-estimate changes also favored the comparison. They added $16.0 million to pre-tax income, against a $5.0 million reduction a year earlier. 5
That $21.0 million swing equals about 34.9% of the $60.2 million EBITDA increase. This is our arithmetic comparison, not CACI's attribution of the gain. 1, 5 The quarter does not establish that the estimate benefit will recur. 5
CACI's margin forecast for the twelve months through June remains in the high-12% range, with the second half above the first. 2 That outlook itself cautions against carrying the September margin unchanged through the period. 1, 2
More revenue carries fixed-price risk
Fixed-price revenue grew by $210.3 million, exceeding the company's total revenue increase of $187.0 million. Cost-plus-fee revenue declined, and nearly all the fixed-price increase came from Domestic Operations. 1, 5
CACI’s fixed-price share stays above its year-earlier level
Fixed-price revenue as a share of total revenue, percent. Quarter ended September 2025 through September 2026.
CACI’s fixed-price share stays above its year-earlier level. Fixed-price share: Sep 2025, 26.7%; Dec 2025, 26.9%; Mar 2026, 31.9%; Jun 2026, 34.8%; Sep 2026, 33.2%.
Fixed-price share
The step up began in the March quarter. ARKA closed that quarter; the reviewed releases and filing do not attribute the change in contract mix to the acquisition.
Source: CACI quarterly releases and September Form 10-Q · September 30, 2026 1, 5, 4, 6, 7
The higher fixed-price share changes the economics of delivery. 1, 10 CACI's annual report describes these contracts as carrying contractor-borne cost-overrun risk, alongside generally greater potential profit. 10
The share stepped up in the March quarter, when CACI acquired ARKA for $2,637.7 million net of acquired cash. The timing coincides; the reviewed releases and filing do not attribute the contract-mix change to ARKA. 5, 6, 7
Technology revenue grew 11.4%, faster than expertise revenue's 3.9% increase. 1 Those categories describe revenue offerings; Domestic and International Operations are CACI's reporting segments. 1, 5
Domestic Operations supplies nearly all CACI’s operating profit growth
Both CACI reporting segments. July–September quarters, GAAP. Revenue and operating income in $ millions; operating margins calculated from segment figures.
Domestic Operations supplies nearly all CACI’s operating profit growth. Domestic revenue: Sep 2025 2,210.0, Sep 2026 2,398.2; Domestic operating income: Sep 2025 199.4, Sep 2026 234.3; Domestic operating margin: Sep 2025 9.0%, Sep 2026 9.8%; International revenue: Sep 2025 77.6, Sep 2026 76.4; International operating income: Sep 2025 12.8, Sep 2026 13.3; International operating margin: Sep 2025 16.6%, Sep 2026 17.3%.
| Segment / measure | Sep 2025 | Sep 2026 |
|---|---|---|
| Domestic revenue | 2,210.0 | 2,398.2 |
| Domestic operating income | 199.4 | 234.3 |
| Domestic operating margin | 9.0% | 9.8% |
| International revenue | 77.6 | 76.4 |
| International operating income | 12.8 | 13.3 |
| International operating margin | 16.6% | 17.3% |
Segment operating margins include depreciation and amortization. They are not EBITDA margins.
Source: CACI September Form 10-Q; TGOs margin calculations · September 30, 2026 1, 5
Domestic Operations supplied 96.9% of revenue and almost all the increase in operating income. International revenue declined, although its operating margin improved. 5 These segment margins include depreciation and amortization and should be read separately from company-wide EBITDA margin. 1, 5
Company-wide intangible amortization rose to $54.3 million from $36.0 million. CACI ties the increase in depreciation and amortization to the timing of intangible assets acquired in fiscal 2026. 5
Department of War revenue supplied 93.4% of total revenue growth. Intelligence Community revenue rose 2.6%, while federal civilian revenue fell 3.7%. The reviewed filing does not break out ARKA's contribution to those customer groups. 5
Interest absorbs most of the operating gain
Higher operating profit produced a much smaller improvement before taxes. CACI attributes the increase in interest expense and other, net primarily to higher outstanding debt balances. 5
Higher interest leaves CACI a smaller pre-tax gain
Change from July–September 2025 to July–September 2026, GAAP, $ millions. Bar lengths show magnitudes; labels and signs identify the effect on pre-tax income.
Higher interest leaves CACI a smaller pre-tax gain. Operating improvement to pre-tax improvement: Operating income: increase, +35.3 increase; Interest and other, net: cost increase, −27.1 deduction; Pre-tax income: increase, +8.2 net increase.
Operating improvement to pre-tax improvement
The increase in interest expense and other, net equals 76.8% of the operating-income gain. The comparison stops before income taxes.
Source: CACI September Form 10-Q; TGOs ratio calculation · September 30, 2026 5
The increase in interest expense and other, net equaled 76.8% of the operating-income gain. That expense consumed 29.6% of operating income, up from 21.8% a year earlier. 5
GAAP diluted earnings per share rose 3.7% to $5.84. Adjusted diluted EPS rose 11.8% to $7.66. 1 The adjusted measure excludes intangible amortization and its related tax effect, making the distinction consequential after the amortization increase. 1, 5
Funded backlog improves beneath a nearly flat total
Quarterly awards totaled $4.8 billion, approximately 61% of it new business to CACI. Awards exclude multi-award indefinite-delivery, indefinite-quantity contract ceilings; they are company bookings, not government obligations. 1
Awards were 3.4% below the year-earlier first quarter. 1 Both September quarters were stronger than the intervening quarters, so the latest total does not by itself establish a new pace of awards. 1, 4, 6, 7 Book-to-bill was 1.95 using unrounded awards and revenue. 1, 5
Two awards supplied about half the quarterly total on CACI's rounded figures. For U.S. Central Command, CACI recognized $1.2 billion of award and backlog value against a $1.5 billion ceiling, based on current requirements. 1
It recognized another $1.2 billion from the U.S. Army Special Operations Command's SOFETOPS 2 task order. 1 The task order runs five years and has a stated value of $1.6 billion; recognized award value does not establish funded value. 1, 5
CACI’s funded backlog rises beneath a nearly flat annual total
Backlog at five quarter-ends, $ billions. Total backlog includes unexercised options; unfunded amounts are total less funded. These are not revenue or cash.
CACI’s funded backlog rises beneath a nearly flat annual total. Sep 2025: Funded, 5.4; Unfunded, 28.5; total 33.9. Dec 2025: Funded, 4.4; Unfunded, 28.4; total 32.8. Mar 2026: Funded, 5.0; Unfunded, 28.4; total 33.4. Jun 2026: Funded, 5.4; Unfunded, 26.6; total 32.0. Sep 2026: Funded, 6.2; Unfunded, 27.8; total 34.0.
Funded backlog reaches $6.2 billion. Unfunded backlog is approximately $27.8 billion, below the year-earlier $28.5 billion.
Source: CACI quarterly releases; TGOs total-less-funded calculations · September 30, 2026 1, 5, 4, 6, 7, 9
Funded backlog rose 14.8% year over year, while total backlog increased just 0.3%. The funded share reached about 18.2%, compared with 15.9% a year earlier. 1
Funded backlog represents appropriated contract value less revenue already recognized. Total backlog also includes unexercised options, so it is a broader measure than remaining performance obligations. 5
CACI reported $14.3 billion of remaining performance obligations and expects approximately 43% to become revenue within twelve months. That forecast is a more specific conversion measure than the full backlog total. 5
The bid pipeline was smaller in the October 22 presentation than on August 6. Submitted bids fell to $4.7 billion from $11 billion. Bids expected over the next two quarters fell to $14.7 billion from $22 billion; neither presentation explains the reductions. 2, 3
CACI describes award activity as improving but not fully normalized. Its presentation also says continuing resolutions have had little impact on its business. These are CACI's assessments of its operating environment. 2
The higher outlook requires growth to accelerate
For the twelve months through June 2027, CACI raised its revenue range by $50 million at each end, to $10.70 billion–$10.90 billion. 1, 4 Its stated reported-growth forecast is 11.8%–13.9%. 2
The revision puts more weight on organic growth. CACI increased that forecast to 7.1%–9.2%, from 6.1%–8.2%. 2, 3 Expected acquired revenue fell to approximately $450 million from $500 million; the October materials do not explain the reduction. 1, 2, 3
CACI’s remaining revenue requirement exceeds the comparable nine months
Revenue, $ millions. October–June periods. Hatched bars show approximate requirements implied by rounded October 21 guidance, not achieved revenue.
CACI’s remaining revenue requirement exceeds the comparable nine months. Equal nine-month periods; common zero baseline: Oct 2025–Jun 2026: actual, 7,280.2; Oct 2026–Jun 2027: low-end requirement, ≈8,225.4; Oct 2026–Jun 2027: high-end requirement, ≈8,425.4.
Equal nine-month periods; common zero baseline
The implied growth requirement is approximately 13.0%–15.7%. CACI expects replacement guidance in February 2027 after its change to a December fiscal year-end.
Source: CACI October 21 guidance, October 22 presentation and quarterly releases; TGOs calculations · October 22, 2026 1, 2, 4, 6, 7, 8
Subtracting the September result from the rounded revenue guidance leaves a remaining-nine-month growth requirement of approximately 13.0%–15.7%. 1, 4, 6, 7 That exceeds the September quarter's reported growth rate, and CACI expects organic growth to be higher in the second half than the first. 1, 2, 4, 6, 7
The higher organic forecast and lower acquired-revenue assumption make the source of future growth consequential. CACI's expected second-half organic acceleration is therefore central to the raised outlook. 2, 3
CACI now classifies 94% of expected revenue as existing business, compared with 83% in August. 2, 3 The remainder is split equally between recompetes and new business in the October presentation. This is the company's forecast composition, not revenue already recognized. 2
Adjusted net income guidance rose to $740 million–$760 million. Adjusted diluted EPS guidance rose to $33.18–$34.08. 1 Both are non-GAAP forecasts for the same twelve-month period. 1, 4
These targets will not be matched against a reported July–June fiscal year following the calendar change. 5, 8 CACI expects new guidance in February; the current materials do not establish how the replacement calendar-year outlook will relate to this range. 1, 2, 8
Free cash flow falls while debt comes down
Free cash flow declined to $133.5 million from $143.0 million a year earlier. CACI's non-GAAP definition deducts capital expenditure from operating cash flow excluding receivables sales under its Master Accounts Receivable Purchase Agreement, or MARPA. 1
Operating cash flow excluding MARPA fell to $144.8 million, which CACI attributes primarily to higher working capital. Days sales outstanding, also excluding MARPA's effect, increased to 59 from 56. 1
Capital expenditure fell to $11.4 million from $17.0 million. The lower spending softened the decline in free cash flow. 1
Receivables sales supplied $16.5 million of cash excluded from those non-GAAP measures. 1 At September-end, receivables outstanding with the purchaser effectively filled the $350 million facility. 5 CACI's cash guidance assumes no MARPA contribution. 1
The free cash flow floor remains $900 million for the twelve months through June. 1, 4 CACI expects approximately 35% of the period's free cash flow in the first half; September generated about 14.8% of the floor. 1, 2
Tax assumptions contribute to CACI’s free cash flow floor
Twelve months through June 2027, non-GAAP forecast, $ millions. Section 174A benefit and calculated remainder are approximate. Hatching denotes forecast assumptions.
Tax assumptions contribute to CACI’s free cash flow floor. At-least-$900 million floor: Floor less tax assumptions, ≈745; Section 174A benefit, ≈115; Prior-year tax-method refund, 40; total 900.
The remainder is TGOs subtraction of the two disclosed tax assumptions from the cash floor. It is not CACI guidance excluding tax items. The floor is unchanged from August.
Source: CACI earnings release and presentation; TGOs subtraction · October 21–22, 2026 1, 2, 4
The tax assumptions matter when comparing that target with operating performance. 1, 2 The floor includes a Section 174A cash tax benefit under the One Big Beautiful Bill Act of 2025 and a refund tied to prior-year tax method changes. 2 Our subtraction isolates those assumptions; it is not a separate company cash forecast. 1, 2
CACI's pro forma leverage declined to 3.5 times from 3.7 times at June-end. The measure divides net debt by trailing-twelve-month EBITDA and includes ARKA's trailing EBITDA on a pro forma basis. 2, 3
CACI now expects leverage in the low threes by March 2027, compared with the June 2027 target shown in August. 2, 3 The target remains a forecast. 2
Cash and cash equivalents rose to $279.4 million from $191.8 million at June-end. Our separate measure, debt principal less cash, fell $154.3 million to $4,585.0 million. 5 This is not a reconstruction of CACI's net-debt definition. 5, 2
Debt principal declined $66.7 million during the quarter, while share repurchases used $4.4 million. 1, 5 CACI retained $1,395.0 million of undrawn revolving capacity and $187.3 million of repurchase authorization. 5
Manufacturing space expands; delivery remains the test
CACI opened a 61,000-square-foot defense electronics facility in the Rochester area. The company says the addition increases its manufacturing space by more than 300%. Space is a capacity input; the announcement does not establish delivered output or incremental revenue. 1
The quarter's combination of more fixed-price work and higher margins makes execution economically consequential: CACI bears cost-overrun risk on a larger share of its revenue. 1, 10 Funded backlog has improved, but the raised outlook still depends on CACI's forecast of faster organic growth in the second half. 1, 2, 3
A separate legal development changed an outstanding exposure. In October, the District Court vacated the judgment arising from the November 2024 $42 million Alien Tort Statute verdict and entered judgment for CACI. Plaintiffs indicated they may seek Supreme Court review; CACI had recognized no amounts in its financial statements. 5
Sources
The comparisons cover CACI alone. Historical quarter labels follow its former June fiscal year-end. Calculations use disclosed figures; rounded forecasts support approximate requirements.
Sources (10)
- CACI fiscal 2027 first-quarter earnings release, October 21, 2026
- CACI Q1 FY27 earnings presentation, October 22, 2026
- CACI Q4 FY26 earnings presentation, August 6, 2026
- CACI fourth-quarter and fiscal 2026 earnings release, August 5, 2026
- CACI Form 10-Q, quarter ended September 30, 2026
- CACI third-quarter fiscal 2026 earnings release
- CACI second-quarter fiscal 2026 earnings release
- CACI Form 8-K, change in fiscal year-end, October 2026
- CACI first-quarter fiscal 2026 earnings release
- CACI fiscal 2026 Form 10-K