Earnings analysis
General Dynamics directs most capital spending to Marine Systems
Submarine orders expand future work, largely through unfunded backlog. Higher investment and lower operating cash reduce quarterly free cash flow despite stronger earnings.
In this analysis
Release, filing and presentation analysis · Q3 2026, ended October 4, 2026
General Dynamics directed most of its third-quarter capital spending to Marine Systems, where investment reached $303 million. The shipbuilding segment accounted for 77.0% of the company’s year-over-year increase in capital spending.1
The spending puts current cash demands alongside a much larger book of future submarine work, with most of Marine’s quarterly backlog increase coming from unfunded work. GD believes that unfunded work is likely to be funded, but future appropriations are not guaranteed. The investment establishes spending today; the disclosures do not quantify when it will produce additional delivered capacity.1
This assessment covers earnings releases, filings and presentations, including prior periods. The webcast and analyst Q&A were not reviewed.
Quarterly cash generation weakens despite higher earnings
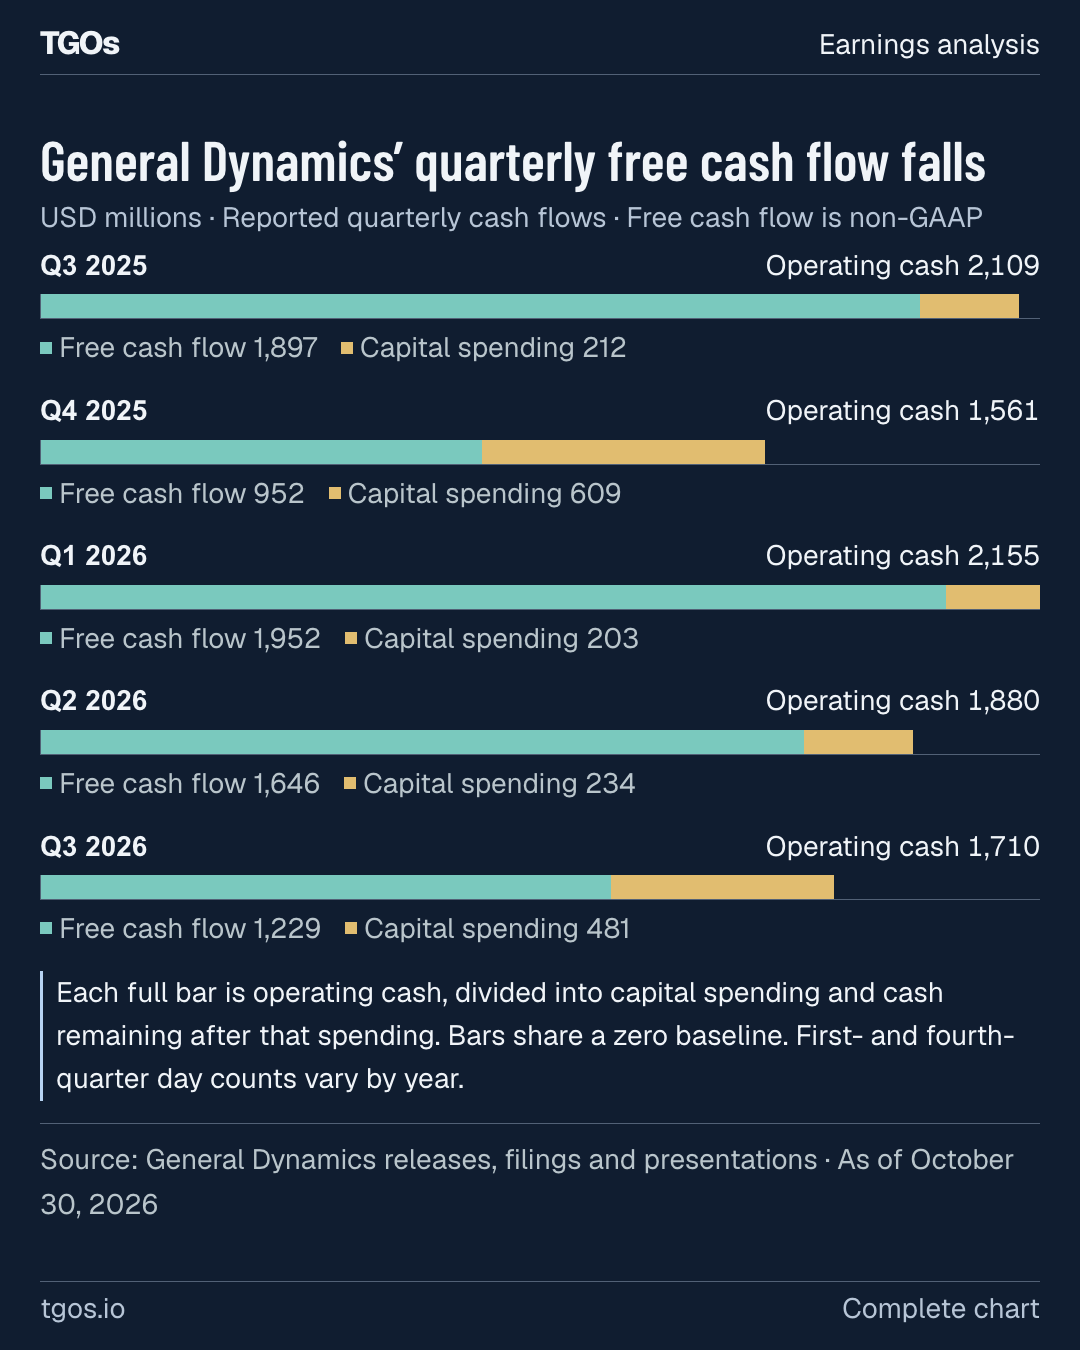
Third-quarter free cash flow fell 35.2% to $1.229 billion, despite higher net earnings. GD defines free cash flow, a non-GAAP measure, as operating cash less capital expenditures.2
Operating cash declined 18.9% year over year, and capital expenditures rose 126.9%.2 Operating cash also fell from the preceding quarter, extending the decline from the first quarter.2, 3, 4
General Dynamics’ quarterly free cash flow falls
USD millions · Reported quarterly cash flows · Free cash flow is non-GAAP
Each full bar is operating cash, divided into capital spending and cash remaining after that spending. Bars share a zero baseline. First- and fourth-quarter day counts vary by year.
Lower operating cash accounts for 59.7% of the free-cash-flow decline, with higher capital spending accounting for the rest. That decomposition separates the two movements without assigning a business cause to each operating-cash line.2
Cash conversion falls on both measures
| Percent of net earnings | Q3 2025 | Q3 2026 |
|---|---|---|
| Operating cash | 199% | 139% |
| Free cash flow, non-GAAP | 179% | 100% |
The nine-month picture remains stronger: free cash flow increased 60.5%, while operating cash rose 61.4%.2 Those year-to-date comparisons run through October 4, 2026, and September 28, 2025; the 2026 window is six calendar days longer.2, 1
Nine-month cash generation remains above the prior year
| USD millions | 9M 2025 | 9M 2026 |
|---|---|---|
| Operating cash, GAAP | 3,559 | 5,745 |
| Capital expenditures, outflows shown positive | 552 | 918 |
| Free cash flow, non-GAAP | 3,007 | 4,827 |
Periods end September 28, 2025, and October 4, 2026. The 2026 period is six calendar days longer.2
GD’s five named working-capital lines improve in aggregate
Subtracting GD’s six-month cash statements from its nine-month statements isolates the quarterly movements. The five named working-capital lines contributed more cash than a year earlier in aggregate, alongside higher earnings and selected non-cash charges. Deferred income tax and operating Other, net more than offset those gains.1, 7
Deferred tax and Other, net outweigh GD’s cash gains
USD millions · Change from Q3 2025 to Q3 2026 · Derived from six- and nine-month cash flow statements
Working capital here includes accounts receivable, unbilled receivables, inventories, accounts payable and customer advances. Selected non-cash charges are depreciation, amortization and equity compensation. This is a line-item reconciliation, not a causal attribution.
The aggregate working-capital improvement masks opposing movements: accounts receivable moved against cash by $429 million, while unbilled receivables improved by $581 million. Customer advances also improved; inventories and accounts payable moved against cash.1, 7
The deferred-tax line moved against cash by $279 million, and Other, net moved against it by $390 million. The filing does not explain the deferred-tax swing or provide a separate quarterly cash narrative.1, 7
GD contributed $500 million to its qualified pension plans during Q3 and includes that payment among its nine-month operating cash outflows.1 The filing does not identify the payment’s cash-flow line, and we could not establish a comparable contribution for Q3 2025. The evidence therefore does not support treating the entire pension payment as an incremental year-over-year explanation.1, 8
Customer advances help explain the distance between the strong nine-month totals and the smaller latest-quarter inflow. By the end of the first half, GD had already recorded 94.8% of its nine-month advance inflow.1, 7
Most of the 2026 advance inflow arrived in the first half
| Customer advances and deposits, USD millions | 2025 | 2026 |
|---|---|---|
| Q1 | 13 | 764 |
| Q2, derived | 93 | 404 |
| Q3, derived | -61 | 64 |
Positive values contribute cash; negative values use cash. Q2 is six months less Q1; Q3 is nine months less six months. First-quarter day counts vary by year.1, 7, 4
The nine-month improvement in customer advances equals 54.3% of the operating-cash increase, an arithmetic share rather than GD’s attribution.2, 1 GD identifies net earnings as the primary cash driver and credits working-capital reductions particularly in Combat Systems and Aerospace.1 The cash explanation does not identify which customers paid the advances or explain their slower inflow during Q3.1, 7
Marine takes most of the added capital spending
The investment increase was concentrated in Marine, though Aerospace and Combat Systems also spent more. GD describes investment in facilities and its workforce to raise capacity for Navy submarine demand.1
Marine Systems leads GD’s capital-spending increase
USD millions · Q3 capital expenditures · Both years use the same zero-based scale
Marine supplied 77.0% of the year-over-year increase. Spending does not establish when additional capacity enters service.
Marine’s capital spending was 4.2 times its quarterly depreciation and amortization. The comparison shows the scale of current investment relative to those accounting charges; it does not measure new production capacity.1 The available disclosures do not separate Navy-supported infrastructure investment from GD-funded spending.1, 9
GD had already forecast rising second-half capital expenditures in July and now expects spending to remain elevated in Q4.1, 7 Marine accounted for 57.0% of capital spending over the first nine months.1
Dividends, buybacks and note repayments nearly match Q3 free cash flow
Dividends, share repurchases and fixed-rate note repayments together used $1.214 billion in Q3 2026, close to the cash remaining after capital spending.2, 1, 7
Selected Q3 2026 cash uses compared with free cash flow
| USD millions; outflows shown positive | Q3 2026 |
|---|---|
| Dividends | 429 |
| Share repurchases | 285 |
| Fixed-rate note repayments | 500 |
| Sum of these three uses | 1,214 |
| Free cash flow, non-GAAP | 1,229 |
Quarterly uses are derived from six- and nine-month statements. These selected uses are not a complete reconciliation of the change in cash.2, 1, 7
GD repaid the quarter’s maturing notes in August using cash on hand.1 Cash and equivalents rose $55 million during Q3 to $4.388 billion.2, 7
Net debt, a non-GAAP measure, fell $3.052 billion from year-end to $2.628 billion.2 GD had no commercial paper outstanding on October 4 and retained a $4 billion committed bank credit facility. The company describes its nine-month share repurchases as covering dilution.1
Growth extends beyond Marine Systems
Consolidated revenue and operating earnings increased from Q3 2025, with revenue growth across all four segments.2, 1 Both measures also rose from the preceding quarter.1, 7
Consolidated results improve from both comparison quarters
| GAAP measure | Q3 2025 | Q2 2026 | Q3 2026 |
|---|---|---|---|
| Revenue, USD millions | 12,907 | 14,094 | 14,566 |
| Operating earnings, USD millions | 1,331 | 1,460 | 1,527 |
| Operating margin | 10.3% | 10.4% | 10.5% |
Marine supplied 52.1% of consolidated revenue growth and 51.0% of operating-earnings growth. Excluding Marine, revenue still increased 9.0%.1
GD’s margin gains concentrate in Aerospace and Marine
Q3 operating margin, percent · All four reported segments · Shared scale starts at zero
Combat Systems and Technologies generated more revenue but reported lower operating margins.
Net interest expense also fell to $45 million from $74 million, helping net earnings beyond the operating improvement.2 For the nine-month period, GD attributes lower net interest expense to less commercial-paper interest and more interest income on larger cash balances.1
Net earnings and diluted EPS increase year over year
| GAAP measure | Q3 2025 | Q3 2026 |
|---|---|---|
| Net earnings, USD millions | 1,059 | 1,229 |
| Diluted EPS, USD | $3.88 | $4.49 |
Aerospace gains from deliveries, mix and services
Aerospace operating earnings rose to $513 million from $430 million. GD attributes manufacturing earnings growth to aircraft deliveries and mix, and services earnings growth to volume and mix.1
In GD’s earnings bridge, aircraft services contributed $49 million of growth and manufacturing added $63 million. Higher general, administrative and other expenses offset part of that increase; GD links higher selling expenses to strong aircraft orders.1
The services business benefited from increased fixed-base operator activity and customer demand for aircraft maintenance, according to GD.1 Aerospace orders exceeded revenue, with a book-to-bill ratio of 1.4.2
Gulfstream delivered 40 aircraft, compared with 39 a year earlier.2 GD reports delays at its Israel-based supplier of mid-cabin airframes caused by Middle East conflicts, without attributing the quarter’s delivery mix to those delays.2, 1
Marine’s margin gains include a contract adjustment
Marine’s revenue increase came mainly from U.S. Navy ship construction, which GD attributes to increased material and labor volume on Columbia- and Virginia-class submarines. The MD&A separates ship construction growth from the increase in engineering, repair and other services.1
Marine’s revenue growth is concentrated in ship construction
| MD&A category, USD millions | Q3 year-over-year increase |
|---|---|
| U.S. Navy ship construction | 661 |
| Engineering, repair and other services | 203 |
| Marine Systems total | 864 |
Marine’s operating margin increased year over year. GD attributes that year-over-year margin increase to improved performance and a favorable adjustment on Virginia-class Block IV as it nears completion. The filing does not disclose the adjustment’s size and says no adjustment on any one contract was material.1
Marine’s reported results also improve sequentially
| Measure | Q2 2026 | Q3 2026 |
|---|---|---|
| Revenue, USD millions | 4,660 | 4,960 |
| Operating earnings, USD millions | 342 | 391 |
| Operating margin | 7.3% | 7.9% |
GD’s explanation of the margin increase addresses the year-over-year comparison, not this sequential comparison.1, 7
Across the company, net contract-estimate adjustments added $44 million to quarterly operating earnings, down from $57 million. Excluding those aggregate net adjustments, operating earnings grew 16.4% by our calculation; this is not a GD-reported performance measure. The aggregate figures do not isolate Marine’s underlying margin or show how its favorable adjustment compares with adjustments on other contracts.1
Separately, the SEC and the Justice Department’s Civil Division contacted GD in August about investigations into Electric Boat’s accounting on submarine contracts. GD cannot estimate a range of possible loss and says the outcome could be material. The filing does not connect the investigations to the Block IV adjustment.1
Artillery production drives Combat’s munitions growth
Combat Systems generated more revenue, while operating earnings fell to $330 million from $335 million. GD attributes weapons-and-munitions growth to increased artillery production. It attributes the lower segment margin to program mix, without identifying munitions as the cause.1
In the MD&A revenue bridge, weapons and munitions account for the full quarterly increase; higher U.S. vehicle revenue and lower international vehicle revenue cancel each other. For the nine-month period, GD attributes lower U.S. vehicle revenue to reduced Army demand during recapitalization and the termination of M10 Booker.1
GD expects short-term combat-vehicle production volumes to be down slightly and munitions demand to remain elevated.1 Combat backlog remained above a year earlier but declined during Q3.2, 1
Technologies grows at both businesses
Technologies recorded growth at both General Dynamics Information Technology and Mission Systems.6 Information technology services contributed $220 million of quarterly revenue growth. Command, control, communications, computers, cyber, intelligence, surveillance and reconnaissance solutions supplied the remaining $139 million.1
Operating earnings increased to $346 million from $327 million, while GD attributed the lower margin to program mix.1 Funded backlog rose year over year, strengthening the funded order book without establishing the timing of its conversion into revenue.2, 1
Marine’s backlog expands mainly through unfunded work
GD received $98.8 billion in quarterly orders, driven by submarine awards. The defense segments’ book-to-bill ratio reached 8.5, measuring orders relative to revenue rather than cash receipts.2
July contract modifications awarded to Electric Boat covered additional Columbia- and Virginia-class submarines, alongside support for shipyard infrastructure. The announced submarine contract values were $29.5 billion for Columbia and $42.1 billion for Virginia.9 Marine’s funded backlog grew far less than these announced contract values.1, 9
Unfunded work drives Marine Systems’ backlog expansion
USD millions · Quarter-end Marine Systems backlog · Funded and unfunded work share one scale
Most of the Q3 increase was unfunded. Funded defense backlog is authorized, appropriated and funded. Hatched portions show work GD believes likely to be funded, without a guarantee of future appropriations.
The expanded order book also changes the company-wide conversion profile. The share expected to become revenue by year-end 2027 fell, even as total remaining performance obligations grew. A smaller percentage of a larger backlog does not by itself establish a decline in near-term revenue dollars.1, 7
GD expects a smaller share of backlog to convert by 2027
| Company-wide remaining performance obligations | July 5, 2026 | October 4, 2026 |
|---|---|---|
| Total, USD billions | $136.5 | $220.3 |
| Expected revenue by year-end 2027 | About 50% | About 30% |
| Additional expected revenue by year-end 2029 | About 30% | About 25% |
The balance is expected thereafter. These are approximate forecast shares of different backlog totals, not cash receipts or obligations.1, 7
GD raises annual revenue and EPS targets
GD raised its annual revenue forecast to $56.5 billion–$56.8 billion, compared with about $55.7 billion in July. Its operating-margin forecast remains around 10.5%.1, 10
General Dynamics raises its annual EPS outlook again
FY2026 forecasts · Diluted earnings per share, USD · Update month
All marks are annual forecasts, not actual earnings. The labeled range scale does not start at zero.
GD also lowered its annual net interest expense assumption to approximately $215 million, compared with $270 million in July.1, 7 That change sits alongside the higher revenue forecast and unchanged operating-margin target.1, 10
Results entering the final quarter, alongside annual targets
| Measure | 9M 2026 actual | FY2026 forecast |
|---|---|---|
| Revenue, USD billions | $42.141 billion | $56.5 billion–$56.8 billion |
| Diluted EPS, USD | $12.83 | $17.20–$17.30 |
Actual results cover the nine months ended October 4, 2026. Forecasts are the October annual outlook.2, 1
For comparison, GD recorded $14.379 billion of revenue and $4.17 of diluted EPS in the final quarter of 2025.5 First- and fourth-quarter day counts vary because GD’s fiscal year ends December 31.1
Gulfstream’s July outlook called for about 160 deliveries for the year; it had delivered 119 through Q3.2, 10 That remains a July-dated benchmark: the Q3 filing updates consolidated guidance without restating the segment outlooks.1, 10
Marine’s July outlook similarly called for about $18 billion of annual revenue and a margin of about 7.4%.7 Its nine-month revenue reached $13.963 billion, with a margin of 7.5%. The favorable Block IV adjustment is part of the reported performance, and its undisclosed size limits conclusions about the margin that will carry into future work.1
The explicit near-term investment signal is that GD expects capital expenditures to remain elevated in Q4. The materials reviewed provide no free-cash-flow forecast, leaving the cash cost of that investment alongside the stronger annual earnings outlook.1
Sources (10)
- General Dynamics, Q3 2026 Form 10-Q
- General Dynamics, Q3 2026 earnings release
- General Dynamics, Q2 2026 earnings release
- General Dynamics, Q1 2026 earnings release
- General Dynamics, Q4 and full-year 2025 earnings release
- General Dynamics, Q3 2026 highlights
- General Dynamics, Q2 2026 Form 10-Q
- General Dynamics, Q3 2025 Form 10-Q
- General Dynamics Electric Boat, July 2026 submarine awards
- General Dynamics, Q2 2026 highlights and outlook