Earnings analysis
Aeronautics supplies Northrop’s segment profit increase
Aircraft and missiles drive sales higher, while contract estimates, taxes and a B-21 asset payment complicate the read-through to profit and cash.
In this analysis
Aeronautics drove Northrop Grumman’s third-quarter growth, generating the largest sales increase and $72 million of additional operating income, more than the $68 million increase in total segment operating income after eliminations. Defense grew rapidly, too, but its shift toward cost-type work held back the margin.1
The earnings recovery includes Defense and Space’s improvement from weaker second-quarter operating income, and depends on more than growing sales. The 10-Q’s aggregate operating-income effect of net estimate-at-completion (EAC) adjustments was $140 million greater than a year earlier. That increase exceeded the total segment profit increase. Lower taxes supported net earnings, and payment for a previously recognized B-21 aircraft sale enlarged adjusted free cash flow. Northrop raised its earnings outlook, but growth’s conversion into profit and cash remains uneven across programs and accounting periods.2134
The quarter in numbers
| Metric | Q3 2025 | Q3 2026 |
|---|---|---|
| Sales, $m | 10,423 | 11,122 |
| Segment operating income, $m | 1,277 | 1,345 |
| Segment margin, % | 12.3 | 12.1 |
| GAAP operating income, $m | 1,242 | 1,269 |
| Net earnings, $m | 1,100 | 1,124 |
| Diluted EPS, $ | 7.67 | 7.89 |
| Operating cash, $m | 1,557 | 1,745 |
Segment operating income and margin are non-GAAP measures. Dollar amounts in millions, except per-share data.1
Aircraft and missiles concentrate the growth
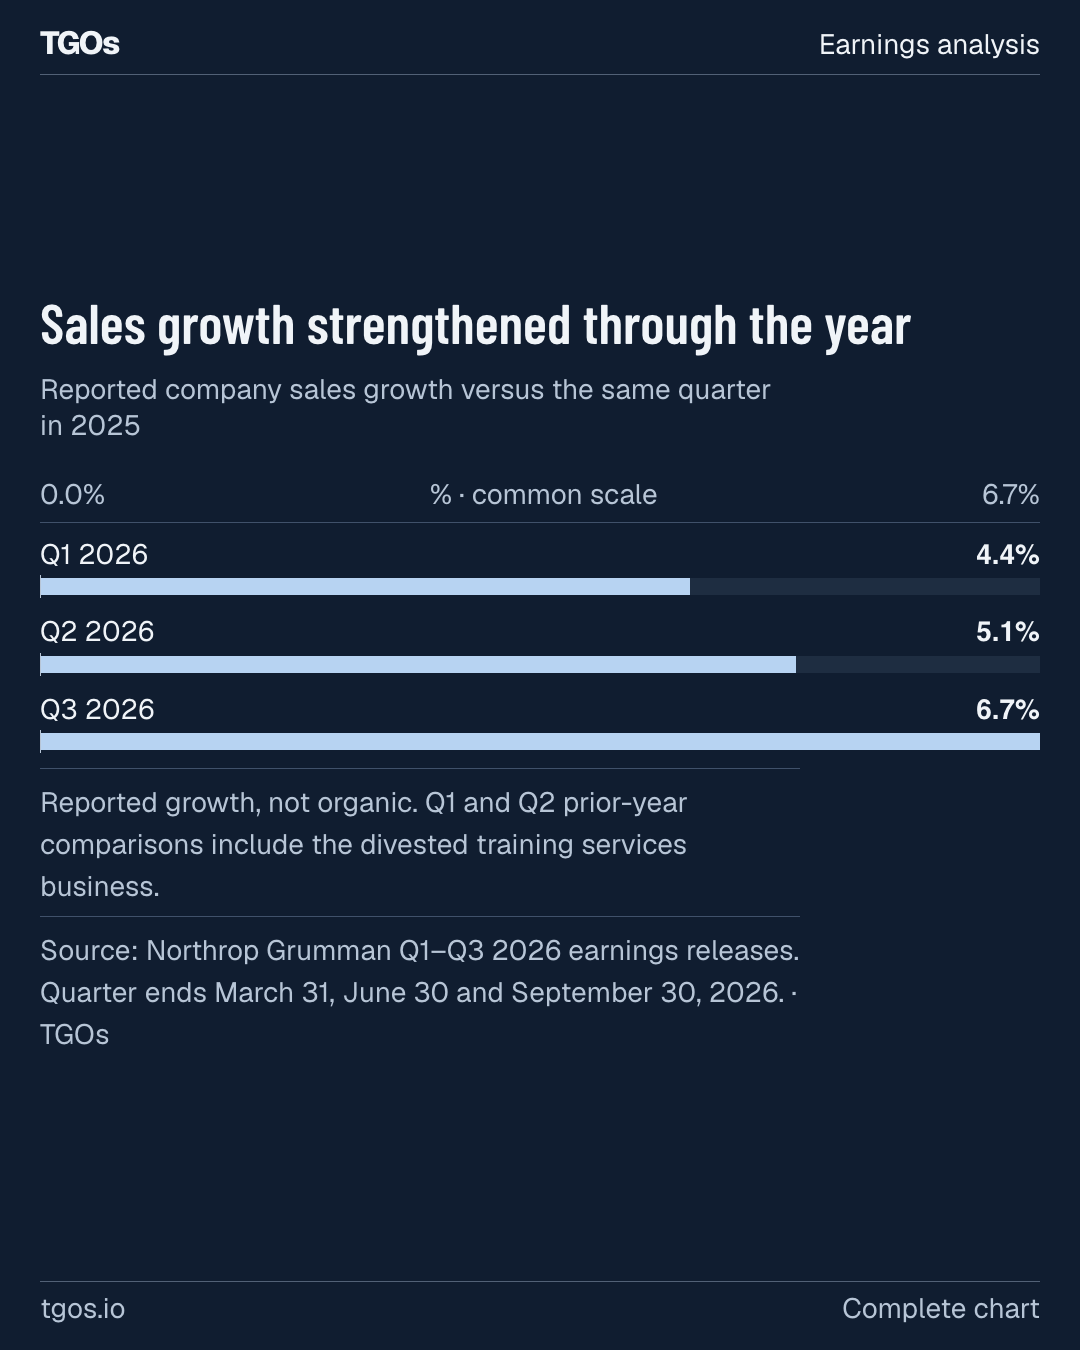
Reported sales growth strengthened in each quarter, reaching 6.7% in the third. The companywide series includes the effect of the training services divestiture, since the earlier prior-year periods contained that business. On that reported basis, Northrop’s revenue expansion gathered pace through the year.421
The composition is more revealing than the acceleration. Aeronautics and Defense supplied most of the increase, while Mission and Space contributed smaller gains. Intersegment eliminations reduced the companywide increase by removing sales between Northrop businesses, bringing the segment totals onto a consolidated basis.1
Aircraft sales growth included production-material timing and sustainment; missile sales growth included Sentinel’s ramp, higher extended-range Guided Multiple Launch Rocket System volume due to award timing and tactical solid rocket motors. Northrop recognizes backlog as sales when costs are incurred or deliveries are made. Material-cost timing and development and sustainment activity are drivers of recognized sales, but do not by themselves establish additional aircraft or missile deliveries. The resulting profit also depends on contract mix, which held back Defense’s margin as sales grew.13
Sales growth strengthened through the year
Reported company sales growth versus the same quarter in 2025
Reported growth, not organic. Q1 and Q2 prior-year comparisons include the divested training services business.421
Source: Northrop Grumman Q1–Q3 2026 earnings releases. Quarter ends March 31, June 30 and September 30, 2026. · TGOs
Aeronautics and Defense supply most of the sales increase
Q3 2026 change from Q3 2025, including intersegment eliminations
Segment amounts include intersegment sales; eliminations reconcile the company total.1
Source: Northrop Grumman Q3 2026 earnings release. Quarter ended September 30, 2026; prior-year comparisons are Q3 2025. · TGOs
Aeronautics carries profit growth, with B-21 obligations still attached
Aeronautics combined 14% sales growth with a 24% increase in operating income. Higher volume helped, while the margin improvement was primarily due to higher net contract margin adjustments, including on certain mature production and sustainment programs. The earnings contribution therefore combines additional business with revised expectations about the profitability of existing work.1
F-35 accounted for $195 million of the sales increase. Northrop attributed that growth to material-cost timing on production lots and increased sustainment volume, alongside higher B-21 sales and B-2 sustainment elsewhere in the segment.13
The quarterly profit improvement is more informative than Aeronautics’ much larger year-to-date comparison. The first quarter of 2025 contained a $477 million B-21 loss provision, depressing the base against which this year’s recovery is measured. The latest quarter’s improvement reflects higher sales and margin, while the year-to-date increase also carries the effect of that earlier loss.41
Northrop’s first-quarter agreement with the Air Force committed to expanding B-21 production capacity and raising the aircraft production rate; the agreement itself does not demonstrate that those increases have been achieved. Northrop says the related sale of a company-owned test aircraft accelerates the low-rate initial production delivery schedule while leaving the expected aircraft quantity for that phase unchanged. These commitments sit alongside the loss-bearing obligations of the existing low-rate initial production phase.43
Northrop has recognized approximately $2 billion of cumulative B-21 low-rate initial production losses, with $1 billion of accrual remaining at September’s end in Other current liabilities. In the first quarter of 2026, the unfavorable estimate revision on the first four low-rate initial production lots was offset by a net reduction in the loss contingency accrual on the remainder of the program. Aeronautics can improve at the segment level while still executing those loss-bearing commitments.3
Aeronautics supplies the largest increase in segment profit
Q3 2026 change from Q3 2025
Segment operating income is a non-GAAP measure; this reconciles its year-over-year change, not GAAP net earnings.1
Source: Northrop Grumman Q3 2026 earnings release. Quarter ended September 30, 2026; prior-year comparisons are Q3 2025. · TGOs
Defense’s rebound still leaves a lower-margin growth mix
Defense’s third-quarter growth reached 12% on both reported and organic bases. Sentinel supplied $180 million of the sales increase, making its ramp a substantial part of the segment’s expansion. Extended-range Guided Multiple Launch Rocket System work and tactical solid rocket motors also grew, while certain military ammunition programs declined.1
Defense’s profit grew more slowly than sales. The earnings release attributed the lower margin primarily to a shift in contract mix toward more cost-type content. A larger workload generated additional operating income at a lower overall margin, showing how the composition of growth shapes its earnings contribution.1
The sequential recovery also needs its second-quarter starting point. Defense’s earlier quarter included a $68 million unfavorable estimate adjustment on the Stand-in Attack Weapon program. Third-quarter operating income recovered to $250 million, making the earlier charge part of the explanation for the sequential comparison. Northrop reported that no EAC adjustment on a single performance obligation significantly affected third-quarter financial statements.312
Defense operating income remained below the prior year through September even as sales grew. Its latest quarter shows a stronger contribution after the earlier charge, alongside a business mix that earns a lower margin than a year ago.1
Defense and Space margins recovered from the second quarter
2026 quarterly segment operating margins
| Segment | Q1 | Q2 | Q3 | 2026 path |
|---|---|---|---|---|
| Aeronautics | 9.3% | 10.3% | 10.5% | |
| Defense | 9.7% | 7.5% | 10.8% | |
| Mission | 15.1% | 15.4% | 15.8% | |
| Space | 9.5% | 8.6% | 11.3% |
Lines share a 0–20% vertical scale. Reported segment margins include contract-estimate adjustments. Q2 includes unfavorable adjustments of $68 million on Stand-in Attack Weapon and $91 million on Graphite Epoxy Motor 63XL; Q1 includes a $71 million unfavorable adjustment on the latter.4213
Source: Northrop Grumman Q1–Q3 2026 earnings releases and Q3 2026 Form 10-Q. Quarter ends March 31, June 30 and September 30, 2026. · TGOs
Mission and Space show why a margin comparison needs a program explanation
Mission Systems remained a substantial profit contributor, producing $500 million of operating income in the quarter. That was nearly level with the preceding quarter, even though sales were lower sequentially. Growth from restricted airborne radar and marine systems was partly offset by lower restricted advanced microelectronics volume, producing a modest year-over-year sales increase across businesses moving in different directions.12
Its year-over-year profit decline has a demanding comparison behind it. The prior-year quarter included a $68 million favorable estimate-at-completion adjustment in restricted advanced microelectronics, recognizing the cumulative effect of revised contract estimates. Current-quarter performance in marine systems and restricted airborne radar supported the margin, while that earlier benefit helped explain its decline from a year ago.13
Space’s recovery came through profitability much more than sequential sales growth. Sales were nearly unchanged from the second quarter, while operating income increased to $312 million. The earlier quarter carried a $91 million unfavorable estimate adjustment on Graphite Epoxy Motor 63XL, following another unfavorable adjustment in the first quarter. The second-quarter $91 million adjustment helps explain why the sequential profit improvement was much stronger than the sales comparison.213
Space’s third-quarter margin increased from a year earlier primarily due to a shift in contract mix toward more fixed-price content. Restricted-space growth also offset lower Commercial Resupply Service sales caused by launch timing. Space and Defense thus illustrate opposite mix effects in the reported quarter: more fixed-price content supported Space’s margin, while more cost-type content reduced Defense’s.1
Estimate changes and taxes amplify the earnings result
Across Northrop, favorable net estimate-at-completion adjustments contributed $221 million to third-quarter operating income, against $81 million a year earlier. These adjustments recognize the cumulative effect of revised contract sales or cost estimates, including work accounted for in prior periods. Their earnings contribution therefore spans work across accounting periods.3
The 10-Q’s aggregate EAC effect on operating income increased by $140 million. That was larger than the $68 million increase in total segment operating income.31
Northrop attributed the decline in segment margin from 12.3% to 12.1% principally to the prior-year favorable EAC adjustment in Mission Systems’ restricted advanced microelectronics portfolio. That earlier adjustment was $68 million. In explaining the current margin rate, the company cited strong program performance and higher margin rates at Aeronautics and Space.1
GAAP operating income followed a different path from segment profit. A smaller pension accounting adjustment between financial and contract accounting partly offset the segment improvement. Comparisons across the year also encounter different bases: the second quarter of 2025 included a gain on the training services divestiture, while the first quarter of 2025 included the B-21 loss provision.1243
Below operating income, third-quarter pretax earnings declined by $25 million, while income tax expense fell by $49 million. Net earnings consequently increased despite the pretax decline. Higher research credits principally explained the lower effective tax rate; pension benefits and lower returns within Other, net also affected the comparison.1
That distinction persists year to date. Pretax earnings grew 5%, while net earnings rose 12%. Lower tax expense helped widen the difference, including the second-quarter remeasurement of uncertain tax positions following developments with the IRS. Those accounting benefits should remain distinct from both contract margins and the separate effect of lower cash tax payments.123
Contract-estimate adjustments added more income than a year ago
Aggregate favorable net EAC effect on operating income
EAC means estimate at completion. These are cumulative catch-up accounting effects included in reported earnings, not separate cash receipts or a company-adjusted profit series.3
Source: Northrop Grumman Q3 2026 Form 10-Q. Quarter ended September 30, 2026; prior-year comparisons are Q3 2025. · TGOs
Most of Northrop’s backlog is not yet funded
Northrop ended September with $109.6 billion of backlog, following a quarter in which net awards exceeded sales. New awards included Virginia-class submarine work. Backlog establishes a broader future workload, whose timing depends on funding and execution.13
Defense holds the largest segment backlog and the largest unfunded amount. Sentinel awards in the second and third quarters help explain the scale of the business being assembled there. Yet 54.3% of companywide backlog was unfunded at September’s end. These are firm orders, but that portion does not carry the authorized and appropriated funding that defines funded backlog.123
Northrop’s backlog definition excludes unexercised options and unawarded indefinite-delivery task orders, giving the unfunded total a basis in firm orders.3
Northrop expects to recognize approximately 35% of September backlog as revenue within the next 12 months. It expects to recognize approximately 55% within the next 24 months. These cumulative companywide revenue forecasts follow recognition as costs are incurred or deliveries are made.3
Defense has the largest backlog and the largest unfunded portion
Backlog at September 30, 2026
Solid: funded · Hatched: unfunded. $ millions; all bars start at zero and share a scale.
Funded means authorized and appropriated. Unfunded firm orders are not cash or an appropriation; options and unawarded indefinite-delivery/indefinite-quantity orders are excluded. Hatched bars are unfunded.1
Source: Northrop Grumman Q3 2026 earnings release and Q3 2026 Form 10-Q. As of September 30, 2026. · TGOs
The B-21 payment changes the cash comparison
Third-quarter operating cash flow improved primarily due to improved trade working capital, according to the company’s earnings release. Operating cash less capital spending reached $1.439 billion, up 14.6% from a year earlier on that comparable basis. Northrop’s reported adjusted free cash flow grew faster because it also included the aircraft-related receipt classified within investing activities.13
The $371 million receipt came from selling the Air Force an aircraft Northrop had intended to use as a company-owned B-21 test asset. Northrop recognized the sale in connection with the first-quarter production agreement and collected the cash in the third quarter, separating the revenue and cash effects across reporting periods.34
The classification follows the asset’s history. Northrop initially capitalized its acquisition costs because it expected to use the aircraft internally. It subsequently recognized the sale as revenue and the asset’s net book value as operating expense, but classified the receipt as investing cash, consistent with the original capital expenditure. That is real customer cash with a different classification from ordinary operating collections.3
Adding the proceeds to operating cash less capital spending produced adjusted free cash flow of $1.810 billion. The receipt accounted for approximately 67% of the year-over-year increase in that measure. This explains why the adjusted cash growth rate was much stronger than the comparable operating-cash-less-capex result.1
Through September, operating cash less capital spending was $594 million, compared with $965 million of adjusted free cash flow including the receipt. The filing attributes the year-to-date operating cash improvement primarily to lower net cash tax payments. The nine-month comparison therefore has a different principal driver from the quarter’s improvement in trade working capital, with the B-21 receipt adding a separate investing-cash contribution to the adjusted measure.13
The equipment sale adds to a stronger operating cash quarter
Q3 2026 cash reconciliation
Operating cash less capital spending, then add equipment-sale proceeds. Adjusted free cash flow is non-GAAP. Floating bars show the subtraction and addition; full bars show totals.1
Source: Northrop Grumman Q3 2026 earnings release. Quarter ended September 30, 2026; prior-year comparisons are Q3 2025. · TGOs
Capital allocation changed most through repurchases
Cash capital spending through September was slightly below the prior year, while dividends increased. Dividends exceeded capital expenditures in the current period, making shareholder distributions the larger of those two disclosed cash outlays.1
The sharpest change was in share repurchases, which fell to $68 million from $1.168 billion in the prior-year period. Far less cash went toward repurchasing shares, while cash capital spending declined only slightly. The scale of the repurchase reduction made it the largest change among those capital-allocation uses.1
Dividends and repurchases together consumed $1.103 billion through September, exceeding adjusted free cash flow for the same nine-month period. Northrop’s historically heavier second-half cash generation makes the remaining quarter consequential to the annual balance between cash generation and shareholder distributions.14
Repurchases fell much more than capital spending
Cash outlays, nine months ended September 30
Cash outlays, not a complete sources-and-uses reconciliation.1
Source: Northrop Grumman Q3 2026 earnings release. Nine months ended September 30, 2026 and 2025. · TGOs
Higher profit guidance leaves a larger sales and cash quarter ahead
Northrop left its full-year sales outlook at $43.75 billion to $44.25 billion, retaining the range raised in July. July and October both guided adjusted free cash flow to $3.1 billion to $3.5 billion, so the third-quarter update raised expected profitability while maintaining the annual sales and adjusted cash ranges.21
We subtract the $371 million receipt already collected from October’s adjusted free cash flow guidance endpoints. This scenario assumes no further equipment-sale proceeds or after-tax impact from discretionary pension contributions. On that basis, the calculated annual operating-cash-less-capex range is $2.729 billion to $3.129 billion. The known receipt counts toward the annual adjusted cash target.1
Segment operating income guidance rose to $4.940 billion to $5.040 billion. The previous range was $4.850 billion to $5.000 billion. Mark-to-market-adjusted earnings per share guidance rose to $29.35 to $29.75. The previous range was $28.60 to $29.10. These non-GAAP outlook measures use different accounting bases from GAAP operating income and diluted EPS, respectively.21
Subtracting the reported nine-month results from the annual sales range yields a fourth-quarter requirement of $11.871 billion to $12.371 billion. Both endpoints exceed third-quarter sales. This is a derived scenario for reaching the annual outlook, not quarterly guidance issued by Northrop. It shows that the unchanged annual sales forecast still requires a higher revenue quarter than the one just reported.142
The corresponding fourth-quarter segment operating income requirement is $1.365 billion to $1.465 billion. That range also sits above the third-quarter result. Reaching it requires additional segment earnings, but the annual outlook does not identify how much would come from volume, contract mix or estimate revisions. The quarter’s favorable estimate contribution makes that distinction especially relevant to interpreting the eventual result.13
Adjusted free cash flow must reach $2.135 billion to $2.535 billion in the fourth quarter to meet the annual range. That requirement already credits the B-21 equipment receipt collected through September. It exceeds third-quarter adjusted free cash flow, placing substantial weight on the final quarter even after that payment.1
Fourth-quarter 2025 free cash flow was $3.235 billion. Operating cash flow in that quarter rose $1.3 billion from a year earlier, primarily due to a $1.1 billion reduction in net cash tax payments.5
The higher profit outlook still leaves a substantial fourth-quarter cash requirement. Lower net cash tax payments primarily drove the year-to-date operating cash improvement and also helped the prior year’s fourth-quarter cash result. The outlook excludes the effects of a prolonged government shutdown or spending limits and other spending cuts, an assumption that remains consequential alongside substantial unfunded backlog.135
Sources and comparison basis
This analysis uses Northrop Grumman’s first-, second- and third-quarter earnings releases, its third-quarter filing and 2025 comparisons. Comparisons distinguish quarterly from year-to-date results, GAAP from non-GAAP measures, and operating cash less capital spending from adjusted free cash flow that includes equipment-sale proceeds. Fourth-quarter requirements are scenarios calculated by subtracting nine-month results from full-year guidance endpoints to show the results needed to meet the annual outlook.