Earnings analysis
Tomahawk and AMRAAM drive RTX’s defense order surge
Two undefinitized awards dominate Raytheon’s quarterly bookings, while tariff refunds account for nearly half of RTX’s adjusted earnings-per-share increase.
In this analysis
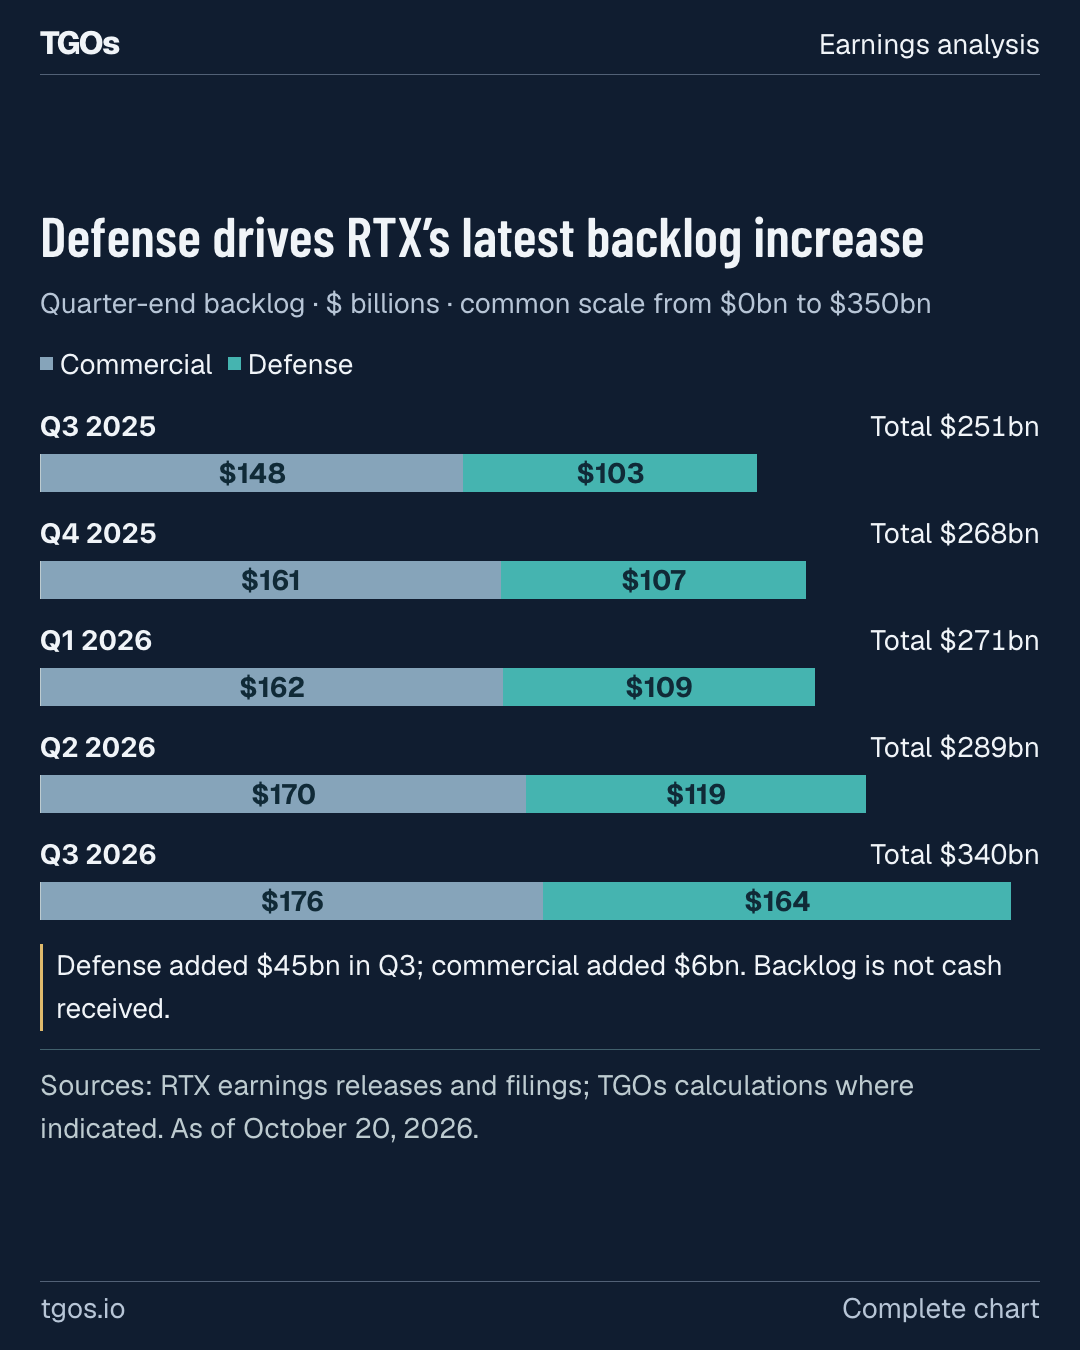
RTX added $45 billion to its defense backlog in the third quarter, as Tomahawk and AMRAAM awards drove a jump in orders. 1, 2, 3 Both awards are multi-year undefinitized production contracts, putting their funding and eventual economics at the center of the growth story. 1, 3, 4
The supplier opportunity is taking shape through RTX’s investment in capacity and its long-term supplier agreements. 3 Annual appropriations govern funding, while the release and Form 10-Q do not establish the awards’ final margins or delivered capacity. 3, 4
Current operations also grew: quarterly sales reached $25.0 billion, up 11% reported and 12% organically. Adjusted earnings per share rose to $2.26, but tariff recovery supplied 44.6% of the year-over-year increase. 1
Defense drives RTX’s latest backlog increase
Quarter-end backlog · $ billions · common scale from $0bn to $350bn
Defense added $45bn in Q3; commercial added $6bn. Backlog is not cash received.
Two missile awards account for most of Raytheon’s bookings 3
Raytheon booked approximately $23.0 billion for Tomahawk and $14.3 billion for AMRAAM during the quarter. The customers are the U.S. Navy and U.S. Air Force, respectively. 3
Excluding those awards, Raytheon’s bookings were about 5.4% below its total intake a year earlier. That comparison shows how concentrated the increase was; RTX cautions that quarterly bookings fluctuate, particularly by segment. 3
Two missile awards dominate Raytheon’s quarterly bookings
Defense bookings · Q3 2025 and Q3 2026 · $ billions · common scale $0bn to $55bn
Tomahawk and AMRAAM account for approximately 71.3% of Q3 2026 bookings. The remainder inherits the awards’ rounding; it is compared with all Q3 2025 bookings.
Even without those awards, Raytheon’s bookings were approximately 1.87 times segment sales, compared with 2.25 times for total bookings a year earlier. These are our calculations using defense bookings and segment sales, including intersegment sales. 3, 8
Other Raytheon bookings included $3.1 billion for Army Collective Training Systems and 15 years of training for the United Kingdom. It also booked $1.8 billion for U.S. Navy SPY-6 hardware production and sustainment. Pratt & Whitney’s defense bookings included $1.3 billion for F117 sustainment and $1.1 billion for F135 sustainment. 3
AMRAAM’s contract limit exceeds its Q3 booking 3
The filing discloses four undefinitized contract actions, or UCAs, awarded across the third quarter and early fourth quarter. 3 The release places Tomahawk and AMRAAM in Q3; the filing does not establish whether the SM-6 or SM-3 Block IB UCAs entered September’s backlog. 1, 3
Award limits and bookings have different meanings
| Program | Disclosed maximum value | Q3 booking tied to this UCA in the release and 10-Q |
|---|---|---|
| Tomahawk | Up to approximately $23.0bn 3 | Approximately $23.0bn 3 |
| AMRAAM | Up to $20.7bn 3 | Approximately $14.3bn 3 |
| SM-6 | Up to $24.4bn 3 | Not established 3 |
| SM-3 Block IB | Up to $6.3bn 3 | Not established 3 |
Maximum values are not obligations. Funding for each UCA depends on annual Congressional appropriations. 3
The AMRAAM booking is approximately $6.4 billion below the disclosed maximum; the Form 10-Q does not explain the difference. AMRAAM, SM-6 and SM-3 Block IB have five-year UCAs with two one-year options each, while Tomahawk runs seven years. The options alone do not establish why the AMRAAM amounts differ. 3
Defense acquisition rules define an undefinitized action as one whose terms, specifications or price have not been agreed before performance begins. 4 RTX discloses contractual recovery remedies if funding is not provided, without describing those remedies in the filing passage. 3 The booked amounts therefore do not establish cash funding or final contract margins. 3, 4
RTX expects approximately 25% of its remaining performance obligations to become revenue over the next twelve months. Approximately 40% relates to Pratt & Whitney commercial maintenance contracts generally expected to be realized over as long as twenty years. Those different conversion periods make the size of the order book an incomplete guide to near-term output. 3
Tariff recovery explains part of the earnings increase 1
RTX includes $0.25 per share of International Emergency Economic Powers Act tariff recovery in adjusted earnings. 1 Removing that recovery leaves adjusted EPS of $2.01, up 18.2% from a year earlier, by our calculation. 8, 1 GAAP EPS was $1.89, including acquisition accounting adjustments and restructuring and other items. 1
The approximate segment recoveries account for 37.8% of the increase in adjusted segment operating profit. RTX says higher taxes and lower pension income partly offset adjusted net income growth. 8
The recovery reimburses previously paid tariffs; RTX had already cited tariff costs as a drag on Collins and Pratt & Whitney in the first quarter. 3, 7 Removing the current recovery isolates its earnings contribution, but the release and Form 10-Q do not quantify prior-year tariff costs for a fully tariff-neutral comparison. 8
Collins and Raytheon retain margin gains after identified benefits
Adjusted segment operating margin · Q3 year-over-year comparison · common scale 0% to 25% · non-GAAP
Collins Aerospace
Excludes approximately $250m of IEEPA recovery.
Pratt & Whitney
Excludes approximately $160m of IEEPA recovery.
Raytheon
Excludes approximately $85m from a contract modification and an offset-obligation adjustment.
Ex-item margins are approximate TGOs calculations removing only the specified Q3 2026 benefits. Prior-year tariff costs are not restated; these are not fully tariff-neutral comparisons.
Commercial volume carries Collins’ profit growth 8, 3
Collins’ adjusted operating profit would still have grown approximately 28.8% without the tariff recovery. RTX attributes its profit improvement to higher commercial volume, commercial mix and the recovery. 8 Defense operating profit was relatively flat as mix mostly offset higher volume. 3
Organic commercial original-equipment sales increased 23%, compared with 9% in commercial aftermarket and 7% in defense. The adjusted comparison also avoids the actuation-business sale gain included in prior-year reported operating profit. 8
Without its tariff refund, Pratt & Whitney’s margin was roughly flat 8
Pratt & Whitney’s tariff recovery accounts for approximately 73.7% of its adjusted operating profit increase. Without it, margin was approximately flat with a year earlier. RTX says commercial aftermarket volume helped profit, while original-equipment mix, aftermarket mix and higher selling, general and administrative costs partly offset growth. 8
Commercial aftermarket sales grew 21%, but commercial original-equipment sales fell 5%. 8 Military sales increased 2%; RTX says the prior-year quarter benefited from the timing of the F135 Lot 18 award. 8, 3
Reported operating profit was $608 million, including a $363 million customer-bankruptcy charge excluded from adjusted results. The release and reviewed Form 10-Q passages do not identify the customer. 8
Raytheon’s margin gains extend beyond the disclosed benefits 8
Raytheon’s margin remained above its year-earlier level after removing the disclosed contract-modification and offset-obligation benefits. 8 RTX attributes the organic operating profit increase to favorable contract-estimate adjustments, higher volume, and mix and other performance. 3
Across RTX, net estimate-at-completion adjustments were favorable by $48 million, versus an unfavorable $35 million a year earlier. Those company-wide amounts have a different scope from Raytheon’s segment-level explanation and should not be added to it. 3
Raytheon’s sales were 2.9% below Q2, despite year-over-year growth. 8, 2 RTX links nine-month favorable mix and other performance primarily to increased Patriot production, including Q2 award timing. That explanation does not establish that sales were pulled forward. 3
Earlier quarters put the margin changes in context
| Adjusted margin | Q4 2025 | Q1 2026 | Q2 2026 |
|---|---|---|---|
| Collins Aerospace | 15.8% 6 | 17.1% 7 | 16.7% 2 |
| Pratt & Whitney | 8.2% 6 | 8.7% 7 | 8.3% 2 |
| Raytheon | 11.6% 6 | 12.2% 7 | 12.6% 2 |
Issuer-stated adjusted operating margins, non-GAAP. No tariff adjustment has been made to these earlier periods.
At RTX overall, organic sales growth was 10% in Q1, 16% in Q2 and 12% in Q3. Each rate compares with its own prior-year quarter, so the sequence alone does not establish a change in demand. 7, 2, 1
Across RTX, acquisitions and divestitures, net, reduced the Q3 reported sales increase by $124 million relative to the organic increase. 8 At Collins, RTX attributes the sales effect of divestitures to the actuation and flight control business and Simmonds Precision Products, both sold in 2025. 3
Quarterly cash flow falls despite higher earnings 8
Operating cash flow declined by $1.771 billion from a year earlier, even with approximately $0.3 billion of tariff-recovery cash. 8, 1 Free cash flow fell 47.4%. 8
RTX’s quarterly cash flow falls from a year earlier
Actual quarterly cash flow · $ billions · common scale $0bn to $5bn · operating cash flow GAAP; free cash flow non-GAAP
Q3 2025
Q4 2025
Q1 2026
Q2 2026
Q3 2026
Q3 2026 operating cash flow includes approximately $0.3bn of tariff recovery. Free cash flow equals operating cash flow less capital expenditures in these periods.
The largest adverse movement among the working-capital lines shown below was contract liabilities, which switched from a cash source to a cash use. Inventory also absorbed cash, while contract assets absorbed less than a year earlier. 8
Contract liabilities drive the largest swing among these selected lines
| Cash-flow effect, $m | Q3 2025 | Q3 2026 | Year-over-year change |
|---|---|---|---|
| Contract liabilities | 986 8 | -980 8 | -1,966 8 |
| Inventory | 182 8 | -543 8 | -725 8 |
| Contract assets | -934 8 | -242 8 | 692 8 |
We show contract liabilities, inventory and contract assets to compare cash effects from advances, inventory and contract balances. Positive amounts provide cash; negative amounts absorb cash. These lines are not a complete operating-cash-flow reconciliation.
For the first nine months, RTX attributes lower cash from contract liabilities primarily to lower Raytheon advances and lower billings relative to revenue recognition, primarily at Pratt & Whitney. That explanation covers the nine-month period, not Q3 alone, and does not establish the advance-payment terms of the new missile awards. 3
The longer cash comparison is stronger: nine-month free cash flow reached $6.306 billion, up 32.9%. 8 RTX estimates an approximately $0.7 billion full-year cash impact from the Powder Metal Matter. 3
Investment rises while buybacks remain absent 8
Quarterly capital spending rose 22.0% to $749 million. 8 RTX says it is investing in technology, capacity expansion and hiring, while executing supplier agreements to support the UCAs. 3 The release and Form 10-Q do not allocate the capital-spending total to munitions or establish how much additional capacity is already operating. 8, 3
Dividends absorbed 45.7% of nine-month free cash flow, with no share repurchases during that period. 8 RTX retained approximately $0.6 billion of repurchase authority at September’s end. 3
The filing flags an executive order that may limit corporate distributions, share repurchases and executive compensation incentives during periods of defense-contractor underperformance. 3 RTX describes its impacts as uncertain; the release and Form 10-Q do not attribute the absence of repurchases to the order. 3, 8
Cash rises and debt edges lower
Higher guidance still implies a softer Q4 sales comparison 1, 8, 6
RTX raised its full-year organic sales growth forecast to 10–11%. 1 The low end of adjusted sales guidance is $5.0 billion above January’s starting point. 1, 7
RTX’s FY2026 outlook moves higher through the year
| 2026 outlook date | Adjusted sales | Organic growth | Adjusted EPS | Free cash flow |
|---|---|---|---|---|
| Jan 27 | $92.0–93.0bn 6 | 5–6% 6 | $6.60–6.80 6 | $8.25–8.75bn 6 |
| Apr 21 | $92.5–93.5bn 7 | 5–6% 7 | $6.70–6.90 7 | $8.25–8.75bn 7 |
| Jul 23 | $95.0–96.0bn 2 | 8–9% 2 | $7.10–7.25 2 | $8.50–8.75bn 2 |
| Oct 20 | $97.0–97.5bn 1 | 10–11% 1 | $7.65–7.75 1 | $9.0–9.2bn 1 |
All entries are issuer forecasts on non-GAAP bases. EPS is per diluted share; organic growth and dollar sales guidance have different comparison bases.
The rounded dollar sales range implies approximately 9.5–10.0% growth against FY2025 adjusted sales. That calculation is on a reported-sales basis, not the organic basis of RTX’s stated growth forecast. 1, 6 Acquisitions and divestitures, net, reduced nine-month reported sales by $885 million in the organic reconciliation. 8
Subtracting nine-month results from full-year guidance gives the approximate remaining-quarter requirements below. The EPS subtraction is approximate for a separate reason: annual and quarterly weighted-average share counts can differ. 1, 8
What the October outlook implies for Q4
| Measure | Q4 2025 actual | Approximate Q4 2026 requirement |
|---|---|---|
| Adjusted sales | $24.24bn 6 | $25.3–25.8bn 1, 8 |
| Adjusted diluted EPS | $1.55 6 | $1.72–1.82 1, 8 |
| Free cash flow | $3.20bn 6 | $2.7–2.9bn 1, 8 |
TGOs calculations from rounded annual guidance. These are approximate requirements, not separate RTX quarterly forecasts; all measures are non-GAAP.
The implied sales comparison is approximately 4.2–6.2% growth from Q4 2025, below the latest quarter’s reported growth rate. This reported-basis calculation does not establish the remaining quarter’s organic growth rate. 1, 8, 6
The implied Q4 free cash flow range is approximately 9.4–15.7% below the year-earlier quarter. The higher annual cash target can therefore coexist with another weaker quarterly comparison after the stronger nine-month result. 1, 8, 6
The release and Form 10-Q do not separate the October earnings-guidance increase into tariff recovery and operating improvement, or specify whether further refunds are assumed. 1, 3 The government has appealed the refund order, although RTX says the appeal had not prevented claims and refunds through the filing. 3
Production commitments leave funding and conversion to follow 3
The missile awards make RTX’s supplier agreements and capacity investments consequential to a much larger defense order book. 3, 1, 2 The remaining economic questions are how annual funding supports that production, what terms are finalized, and how the work converts into revenue and cash. 3, 4
Sources and basis
This is a release-and-Form-10-Q analysis. RTX’s official event page links to presentation slides and an audio replay; neither was reviewed for this analysis, which includes no earnings-call commentary or analyst Q&A. No transcript link appears on the event page. 9 We cover RTX’s three reportable segments, including intersegment sales, rather than a selected company peer group. Adjusted results, organic growth and free cash flow are non-GAAP. Ex-item figures remove only the specified current-quarter benefits and are approximate where the inputs are approximate. 8 Operating explanations are RTX’s; we did not independently corroborate them with customer or government data.
Sources (9)
- RTX, Q3 2026 results, October 20, 2026
- RTX, Q2 2026 earnings release, July 23, 2026
- RTX, Form 10-Q for the quarter ended September 30, 2026
- Defense Federal Acquisition Regulation Supplement, 217.7401 definitions
- RTX, Q3 2025 earnings release, October 21, 2025
- RTX, Q4 and FY2025 earnings release, January 27, 2026
- RTX, Q1 2026 earnings release, April 21, 2026
- RTX, Q3 2026 earnings release filed with the SEC
- RTX, Q3 2026 earnings conference call event page