Earnings analysis
V2X's Q3 revenue growth rests on discrete mission activities
Removing the increase V2X attributes to discrete national security mission activities leaves a revenue decline in our calculation. Kuwait task-order revenue falls alongside Middle East revenue.
In this analysis
V2X grew third-quarter revenue to $1,271.5 million, up 8.9% from a year earlier.1 The gain was smaller than the increase V2X attributed to discrete activities supporting a national security mission.1,2
That distinction changes the reading of the quarter: removing the disclosed increase leaves a $24.6 million decline, or approximately 2.1% of prior-year revenue, in our calculation.1,2 V2X also raised its full-year revenue forecast, while operating profit grew more slowly than sales.1
This Assessment covers V2X's earnings releases and filings, including the quarter ended October 2, 2026.1 No conference-call content or analyst Q&A was reviewed.
The remaining revenue change turns negative
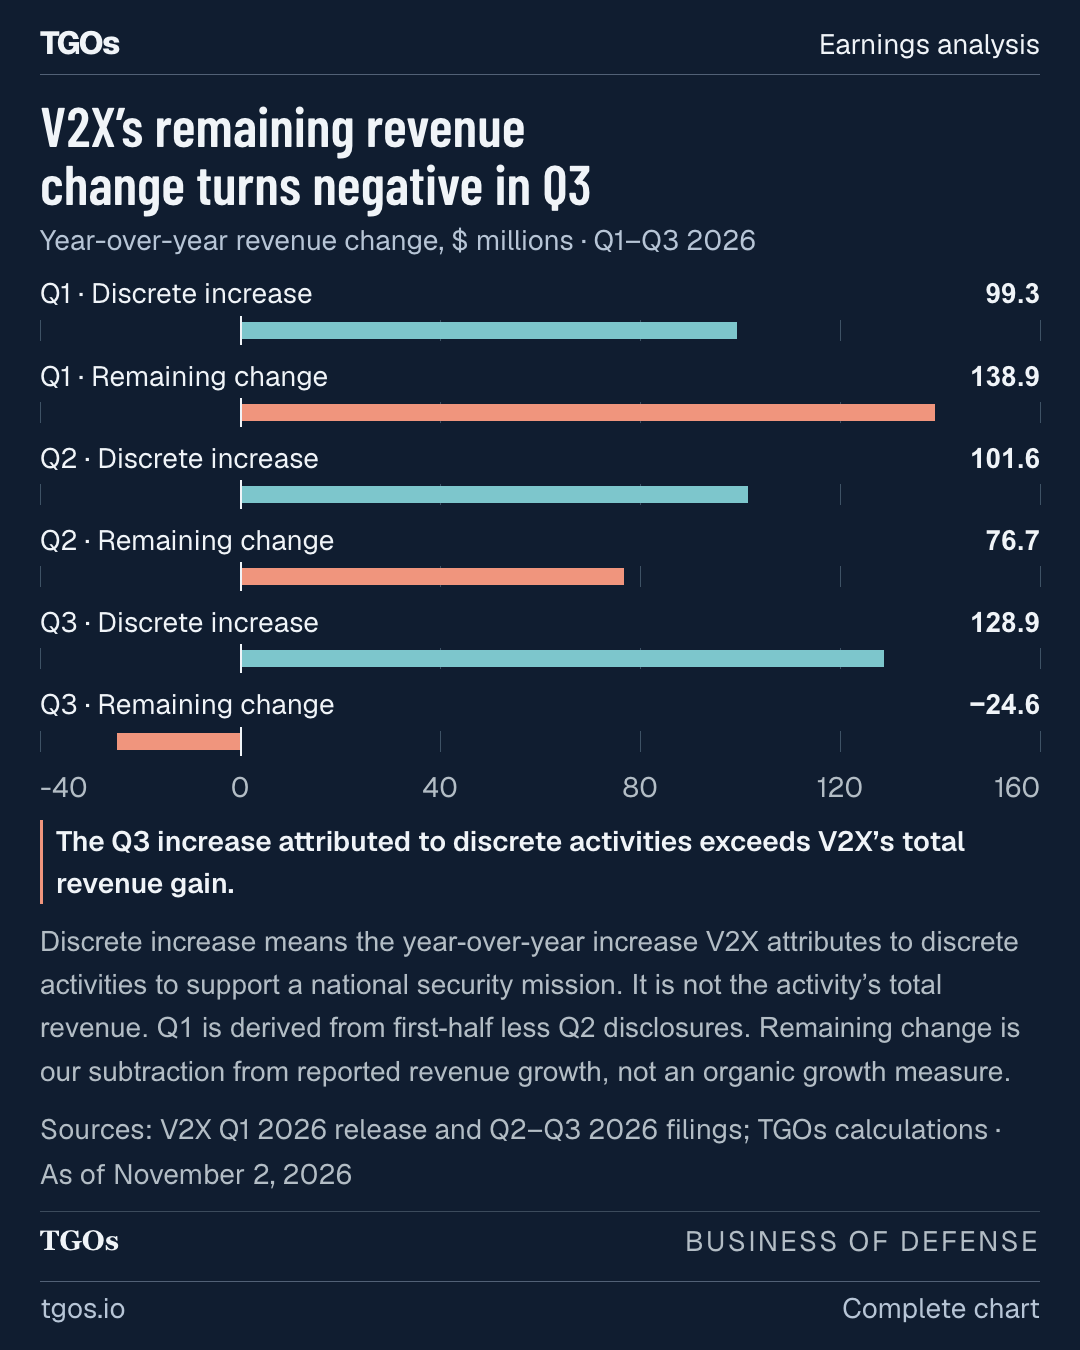
Reported year-over-year revenue growth slowed from 23.4% in the first quarter to 16.5% in the second and 8.9% in the third.1,3,4 Over the same sequence, the increase attributed to discrete mission activities grew, while the remainder of the revenue change moved from positive to negative.1,2,3,4,5
V2X’s remaining revenue change turns negative in Q3
Year-over-year revenue change, $ millions · Q1–Q3 2026
V2X’s discrete mission-activity increase rises from $99.3 million in Q1 to $128.9 million in Q3. The remaining revenue change falls from positive $138.9 million to negative $24.6 million.
The Q3 increase attributed to discrete activities exceeds V2X’s total revenue gain.1,2
Sources: V2X Q1 2026 release and Q2–Q3 2026 filings; TGOs calculations · As of November 2, 20261,2,3,4,5
The remainder nets together gains and losses across the business. V2X attributed Q3 growth partly to aerospace and modernization program increases, offset in part by reduced Middle East scope.2 For the nine months, removing the disclosed discrete increase still leaves approximately 5.9% growth relative to prior-year revenue.1,2
These calculations remove an attributed year-over-year increase, not the activity's revenue level.1,2 V2X does not disclose whether those activities will continue, and discrete does not establish that they are one-time work.2 We do not treat the remainder as organic growth: V2X acquired a business in Q3 2025 that it described as a specialized intelligence business.6 Its contribution to the 2026 comparison is not disclosed.
Kuwait task-order revenue falls alongside Middle East revenue
The clearest disclosed source of contraction is the Logistics Civil Augmentation Program V Kuwait task order.2,5 In May, the Army notified V2X that it would reduce the task order's scope and extend the revised work through December 31, 2026, for $22.6 million.2
Subtracting first-half task-order revenue from the nine-month figures gives the quarterly comparison below.2,5 The derived Kuwait decline is equivalent to about 90% of the Middle East revenue reduction.1,2,5
V2X’s Kuwait task-order revenue falls alongside Middle East revenue
Q3 revenue, $ millions · Geographic total and task-order comparison
V2X Middle East revenue declines from $344.6 million to $240.5 million. Derived LOGCAP Kuwait revenue falls from $104.8 million to $11.5 million.
The derived Kuwait decline is equivalent to about 90% of the Middle East decrease.1,2,5
Sources: V2X Q3 2026 release and Q2–Q3 2026 filings; TGOs calculations · As of November 2, 20261,2,5
Middle East revenue had still been growing in the second quarter, up 1.3% year over year, before contracting in Q3.1,4 V2X removed $414.6 million from backlog because of the Kuwait modification in the quarter ended July 3.2
Management does not currently expect the Kuwait reduction to have a material adverse effect on V2X's financial condition or results of operations.2 Our calculation isolates the disclosed discrete increase: it exceeded the total Q3 revenue gain, leaving a net decline in the remaining revenue change.1,2
The customer mix shifts away from the Army
Army customer revenue fell 24.8% year over year in Q3, while Air Force revenue rose 50.0%.1 The same pattern held in Q2, when Army revenue fell 7.7% and Air Force revenue rose 99.6%.4
| Customer category | Q3 2025 revenue | Q3 2026 revenue |
|---|---|---|
| Army | $449.0m | $337.7m1 |
| Navy | $390.5m | $389.7m1 |
| Air Force | $167.6m | $251.3m1 |
| Other | $160.0m | $292.8m1 |
The table includes all four customer categories V2X discloses. Army revenue represented 26.6% of Q3 sales, down from 38.5% a year earlier. Separately, revenue from U.S. programs rose 30.6%, while Asia grew 8.3% and Europe declined 13.9%.1
V2X reports one operating segment, so these customer and geographic splits do not establish separate profit contributions.2
Contract-type disclosures show another change in mix: time-and-materials revenue reached $159.9 million from $28.1 million. Cost-plus and cost-reimbursable revenue fell 1.4%, and firm-fixed-price revenue fell 4.0%.1
Profit growth trails sales despite sequential margin recovery
GAAP operating income rose 6.8% to $59.5 million. Adjusted earnings before interest, taxes, depreciation and amortization rose 4.0% to $88.6 million. Both grew more slowly than revenue. GAAP operating margin fell to 4.7% from 4.8%, and adjusted EBITDA margin fell to 7.0% from 7.3%.1
Contract-estimate changes were less favorable: aggregate cumulative adjustments reduced operating income in Q3 2026 after increasing it a year earlier. That was a $3.6 million adverse swing, though the disclosures do not isolate its contribution to the margin change.2
Within 2026, GAAP margin has recovered as selling, general and administrative expenses consumed a smaller share of sales.1,3,4
| Measure | Q1 2026 | Q2 2026 | Q3 2026 |
|---|---|---|---|
| GAAP operating margin | 3.5%3 | 4.3%4 | 4.7%1 |
| Adjusted EBITDA margin, non-GAAP | 6.8%3 | 7.1%4 | 7.0%1 |
| SG&A / revenue | 4.9%3 | 4.4%4 | 3.5%1 |
| M&A, integration and related costs | $13.4m3 | $7.7m4 | $1.2m1 |
M&A, integration and related costs, excluded from adjusted measures, fell through the year, alongside the improvement in GAAP operating margin. Adjusted EBITDA margins remained within the narrower range shown above.1,3,4 For the nine months, V2X attributed higher SG&A to revenue-related operating costs, non-recurring integration initiatives and expenses to evaluate potential M&A opportunities.2 The disclosures do not identify those opportunities.
Below operating income, lower net interest expense helped earnings grow faster. Net interest expense declined by $4.4 million, accounting for approximately 50.5% of the pretax income increase.1 The effective tax rate also fell to 22.9% from 24.9%.2
GAAP net income rose 30.0%, with diluted earnings per share of $1.01 versus $0.77. Separately, non-GAAP adjusted diluted EPS reached $1.64, compared with $1.37.1 The earnings improvement therefore includes lower net interest expense and a lower effective tax rate, alongside growth in operating profit.1,2
Receivables activity separates the two cash measures
Third-quarter operating cash improved on both bases. GAAP cash flow reached $67.3 million from $39.4 million, and adjusted operating cash flow rose to $61.8 million from $35.8 million. The nine-month picture is less straightforward, with GAAP operating cash negative and adjusted operating cash positive.1
V2X’s adjusted cash improves while GAAP cash remains negative
Operating cash flow, $ millions · Nine months ended September 26, 2025 and October 2, 2026
Nine-month GAAP operating cash is negative $41.0 million in 2026, versus negative $27.5 million in 2025. Adjusted operating cash improves from negative $24.1 million to positive $111.5 million.
The release adds back $141.1 million of MARPA facility activity in 2026.1
Sources: V2X Q3 2026 release and filing · As of November 2, 20261,2
The release's MARPA facility adjustment accounts for 92.5% of the nine-month gap between GAAP and adjusted operating cash flow. M&A, integration and related payments account for the remainder, apart from a small printed discrepancy.1
The 10-Q describes net cash outflows from receivable sales through the MARPA facility of $133.0 million, plus $83.2 million of working-capital outflows.2 Those receivable-sale outflows reduced reported operating cash; the adjusted measure excludes MARPA facility activity.1,2
The two disclosures use different MARPA measures. The release's facility-activity adjustment exceeds the 10-Q's net outflow excluding fees by $8.1 million, without a reconciliation. For nine months 2025, the release lists a negative $8.6 million adjustment, while the 10-Q reports $17.0 million of net proceeds.1,2 We keep those measures distinct.
The release's MARPA adjustment was concentrated in the first half; its Q3 adjustment was negative, meaning the facility activity helped GAAP operating cash that quarter.1,4 Both years in the chart use the Q3 2026 release's adjusted-cash comparison, including its exclusions for MARPA activity and M&A-related payments.1
Adjusted operating cash is not free cash flow. Capital-asset purchases used $6.7 million in the first nine months, versus $9.7 million a year earlier. The cash-flow statement's nine-month GAAP figure differs from the release's non-GAAP reconciliation by $1,000, with no effect at the displayed precision.1
Debt falls in Q3 but remains above year-end
V2X ended Q3 with $811.7 million of net debt and net leverage of 2.2 times trailing bank EBITDA, both company-defined non-GAAP measures.1 Net debt fell $64.4 million from Q2 but remained $53.9 million above December 31, 2025.1,4,7 V2X reported a $140.3 million improvement in net debt from a year earlier.1
Cash, cash equivalents and restricted cash declined $103.9 million from year-end. Long-term debt repayments used $51.0 million during the nine months, while V2X made no share repurchases, compared with $10.0 million a year earlier.1
The year-end leverage forecast is also less demanding than the May wording: V2X expects approximately 2.0 times, compared with less than 2.0 times in its Q1 release.1,3
Most of the backlog increase is unfunded
Total backlog grew 10.5% from a year earlier, while funded backlog grew 13.7%.2,8
| Backlog, $ millions | September 26, 2025 | December 31, 2025 | July 3, 2026 | October 2, 2026 |
|---|---|---|---|---|
| Total | 11,5748 | 11,1162 | 12,7275 | 12,7872 |
| Funded | 2,2798 | 2,3032 | 2,5205 | 2,5912 |
Since year-end, unfunded backlog increased $1,383 million, compared with $288 million for funded backlog. Unfunded backlog includes probable unexercised options and excludes potential orders under indefinite-delivery, indefinite-quantity contracts. Its growth therefore does not establish an equivalent increase in funded work.2
Bookings have varied sharply. Approximate book-to-bill moved from 0.7 times in Q4 2025 to 3.2 times in Q1 2026, then 0.5 times in Q2 and 1.2 times in Q3.1,3,4,7 The Q2 comparison coincided with the LOGCAP Kuwait backlog removal.2,4
Total backlog rose only $60 million during Q3 despite book-to-bill above one.1,2,5 Approximate ratios and the absence of a complete backlog roll-forward prevent a reconciliation; we do not turn those ratios into precise bookings dollars.
V2X received $4.1 billion in funded orders during the nine months, up $0.8 billion.2 Funding received, backlog and revenue recognized describe different stages of the business; the rounded orders figure does not reconcile the backlog movement.
Higher guidance still permits a Q4 revenue decline
V2X raised its full-year revenue range again in November.1 The low end is $275 million above the initial February forecast.1,7 President and Chief Executive Officer Jeremy C. Wensinger attributed the November 2 increase to year-to-date performance, the backlog position and existing demand signals.1
V2X raises its revenue forecast through 2026
Full-year revenue ranges, $ millions · Forecasts, with FY2025 actual as a reference
V2X full-year 2026 revenue guidance rises from $4,675–$4,825 million in February to $4,950–$5,100 million in November. FY2025 actual revenue was $4,480.0 million.
The November low end is $75 million above August.1
Sources: V2X FY2025 and Q1–Q3 2026 earnings releases · As of November 2, 20261,3,4,7
V2X also raised its full-year non-GAAP forecasts for adjusted EBITDA, adjusted diluted EPS and adjusted operating cash flow. Subtracting nine-month actuals gives the approximate Q4 amounts below; these are our calculations, not company-issued quarterly guidance.1
| Measure | Full-year 2026 forecast | Approximate Q4 remainder | Q4 2025 actual |
|---|---|---|---|
| Revenue, $m | 4,950–5,1001 | 1,168–1,3181 | 1,2197 |
| Adjusted EBITDA, $m | 352.5–367.51 | 88.5–103.51 | 88.77 |
| Adjusted diluted EPS, $ | 6.15–6.551 | 1.35–1.751 | 1.567 |
| Adjusted operating cash flow, $m | 175–1951 | 63.5–83.51 | 172.47 |
The revenue remainder allows anything from an approximate 4% decline to an 8% increase against Q4 2025.1,7 Dollar guidance is rounded, so those growth endpoints are approximate; the EPS subtraction also depends on differing share counts.1
The adjusted-cash remainder is well below last year's fourth quarter, following stronger nine-month adjusted cash generation.1,7 The releases do not explain the expected cadence. Last year's fourth quarter generated more adjusted operating cash than the full year, illustrating how much the timing can matter.7
The disclosed Kuwait extension keeps that task order at reduced scope through year-end.2 V2X does not disclose whether guidance assumes continued increases from the discrete mission activities.1,2 That leaves the durability of the reported revenue growth unresolved, even as the higher forecast and funded backlog show progress on different measures.1,2,8
Sources (8)
- V2X Q3 2026 earnings release, SEC Exhibit 99.1, November 2, 2026
- V2X Form 10-Q, quarter ended October 2, 2026
- V2X Q1 2026 earnings release, SEC Exhibit 99.1, May 4, 2026
- V2X Q2 2026 earnings release, SEC Exhibit 99.1, August 3, 2026
- V2X Form 10-Q, quarter ended July 3, 2026
- V2X Q3 2025 earnings release, SEC Exhibit 99.1, November 3, 2025
- V2X Q4 and full-year 2025 earnings release, SEC Exhibit 99.1, February 23, 2026
- V2X Form 10-Q, quarter ended September 26, 2025