Earnings analysis
Palantir’s revenue growth outpaces total contract value growth
Revenue nearly doubled as U.S. commercial revenue passed U.S. government revenue. Closed contract value grew 6% year over year against a company-reported record base.
In this analysis
Palantir’s third-quarter revenue reached $2.313 billion, up 96% from a year earlier. Closed total contract value grew 6% year over year, with that measure including potential option value.1 The comparison follows Q3 2025 contract value of $2.76 billion, which Palantir described at the time as a record.5
Revenue growth therefore ran ahead of growth in closed contract value, even as Palantir raised its full-year revenue outlook. Receivables also absorbed approximately $409.6 million of cash during Q3. The results pair expanding revenue and operating profit with slower contract-value growth and a larger receivables balance.1, 2
This Assessment is based on Palantir’s earnings releases and its June-quarter Form 10-Q.
U.S. commercial growth adds to a growing government business
Revenue growth climbed across the five-quarter comparison, from 63% in Q3 2025 to 70% in Q4.4, 5 It then reached 85%, 93% and 96% in the first three quarters of 2026.1, 2, 3 Nine-month revenue was $5.881 billion, up 91.7% from the comparable 2025 period.1
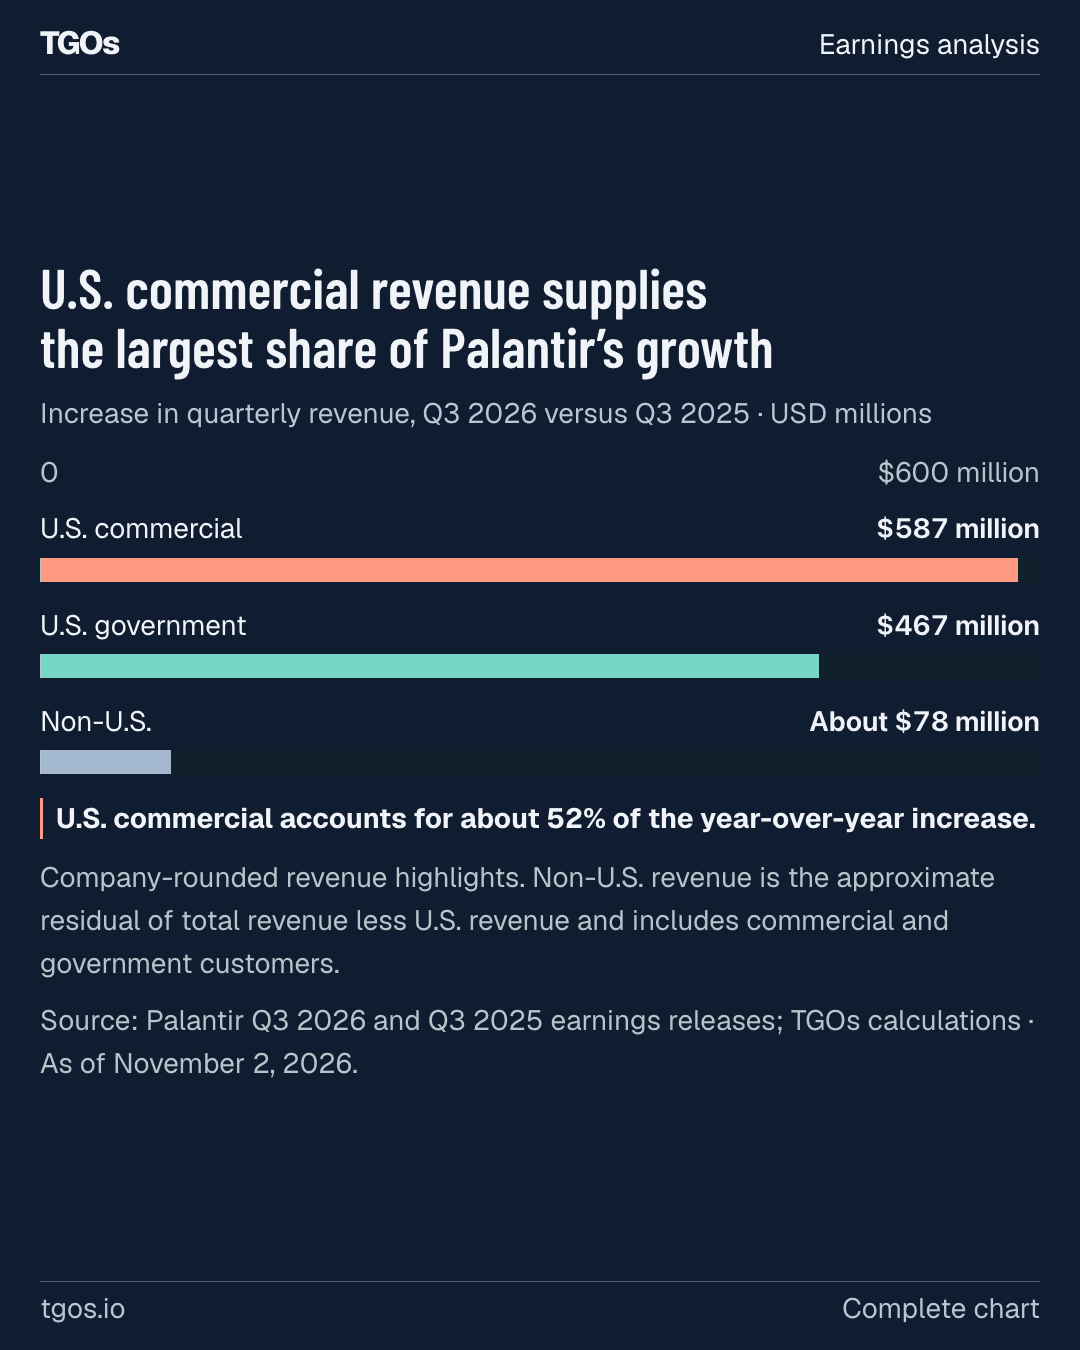
U.S. commercial revenue reached $984 million, ahead of U.S. government revenue of $953 million.1 U.S. commercial customers supplied the largest share of the year-over-year revenue increase, while U.S. government customers supplied another substantial portion.1, 5
U.S. commercial revenue supplies the largest share of Palantir’s growth
Increase in quarterly revenue, Q3 2026 versus Q3 2025 · USD millions
U.S. commercial accounts for about 52% of the year-over-year increase.
Company-rounded revenue highlights. Non-U.S. revenue is the approximate residual of total revenue less U.S. revenue and includes commercial and government customers.
Source: Palantir Q3 2026 and Q3 2025 earnings releases; TGOs calculations · As of November 2, 2026.1, 5
The crossover reflects faster U.S. commercial growth, with revenue up 148% year over year, alongside U.S. government growth of 96%.1 U.S. government revenue for the first nine months was approximately $2.449 billion.1, 2, 3 That already exceeded the $1.855 billion recorded for all of 2025, though the periods differ in length.1, 2, 3, 4
The U.S. business accounted for about 84% of quarterly revenue.1 Non-U.S. revenue, derived from rounded totals, was approximately $376 million and grew about 26% year over year.1, 5 Revenue was increasingly concentrated in the U.S. business, whose share exceeded the June quarter’s level.1, 6
The government total establishes revenue growth without identifying its program-level drivers. The release does not name the agencies, programs or contracts responsible for the increase, so it cannot establish a change in any particular defense program’s spending or delivery.
June-quarter segment margins rose in both businesses
The U.S. government revenue line covers a narrower business than Palantir’s Government segment, which includes U.S. and non-U.S. government agencies.1, 6 The U.S. commercial crossover therefore does not establish that Commercial overtook Government across the global reportable segments.
The June-quarter filing provides the available segment comparison. Both segments expanded their contribution margins from a year earlier, with Commercial generating the higher contribution margin.6
Palantir’s June-quarter contribution margins rose in both segments
Q2 figures only · Global reportable segments, including U.S. and non-U.S. customers
| Segment | Q2 2026 revenue | Q2 2025 contribution margin | Q2 2026 contribution margin |
|---|---|---|---|
| Government | $990.0 million | 63.4% | 70.8% |
| Commercial | $945.4 million | 63.8% | 77.7% |
Contribution is segment revenue less related cost of revenue and sales and marketing expense, excluding stock-based compensation. It does not deduct research and development or general and administrative expense.
Source: Palantir Form 10-Q for the quarter ended June 30, 2026; TGOs calculations · As of November 2, 2026.6
Government customers present at December 31, 2025 supplied $428 million of the $437 million year-over-year increase in Q2 Government revenue. Commercial customers present at the same date supplied $407 million of their segment’s $495 million increase.6
That cutoff does not isolate growth within accounts already present in Q2 2025: it can include customers added later in 2025.6 Nor do the June-quarter figures identify the source of Q3 growth.
Contract value grows more slowly than revenue
Total contract value, or TCV, measures the potential lifetime value of contracts at execution. Remaining deal value, or RDV, measures remaining contract value at period-end. Both assume all options are exercised and no contracts are terminated, although most contracts permit termination, including for convenience. RDV may also exclude commercial contract value based on assessments of customer financial condition.1
Quarterly TCV was $2.918 billion, up 6% year over year but down approximately 13.5% from Q2.1, 2 The prior-year base had itself risen 151%, according to Palantir’s Q3 2025 release.5
U.S. commercial TCV grew 11% year over year and fell approximately 31.4% sequentially.1, 2 The year-earlier comparison was $1.31 billion, up 342% and described by Palantir at the time as a record.5
The sequential comparison follows what Palantir described as record U.S. commercial TCV in Q2.2 Total TCV also varied across the five-quarter comparison, including a larger Q4 2025 and a smaller Q1 2026 than the latest quarter.1, 3, 4 One quarter’s decline does not establish a sustained decline in demand.
U.S. commercial RDV reached $6.517 billion, up 79% from a year earlier.1 Its sequential growth fell behind revenue growth in Q3 after the two measures grew at similar rates in Q2.1, 2
Palantir’s U.S. commercial revenue outgrows remaining deal value in Q3
Quarter-over-quarter growth · U.S. commercial business · Company-stated percentages · Latest quarter: Q3 2026
Q3 2025
Q4 2025
Q1 2026
Q2 2026
Q3 2026
In Q3 2026, revenue grew 29% sequentially; remaining deal value grew 4%.
Remaining deal value is a period-end stock; revenue is a quarterly flow. RDV assumes all options are exercised and no terminations. It may exclude commercial contract value based on customer financial condition. Most contracts permit termination, including for convenience.
Source: Palantir quarterly earnings releases, Q3 2025 through Q3 2026 · As of November 2, 2026.1, 2, 3, 4, 5
RDV equalled approximately 6.6 times the quarter’s U.S. commercial revenue, down from about 9.1 times a year earlier.1, 5 Contract options and termination rights make that ratio unsuitable as a measure of guaranteed revenue coverage.1
The separate accounting measure, remaining performance obligations, was $4.9 billion at June 30. Palantir expected approximately 43% to become revenue over the following 12 months.6 September-end remaining performance obligations were unavailable in the release, preventing a current comparison with the company’s contract-value measures.
The release does not explain the divergence between revenue and contract value. It provides no basis to attribute the difference to delayed deals, customer consumption or contract duration. A stronger subsequent quarter for new contract value would change the comparison; the current evidence supports a gap in growth rates, without establishing its cause.
Operating expenses grow more slowly than revenue
GAAP operating expenses grew 45.6% year over year, well below revenue growth of 95.9%. GAAP operating margin increased from 33.3% a year earlier to 46.9%. Revenue growth outstripping operating expense growth accounts for most of the improvement in operating margin.1
Approximately 73% of the year-over-year revenue increase became additional adjusted operating income. That non-GAAP measure excludes stock-based compensation and related employer payroll taxes. Adjusted operating margin rose from 51% to 62% year over year.1
Stock-based compensation remained a substantial adjustment at $318.9 million. It represented 13.8% of revenue, compared with 14.6% a year earlier.1
Sequentially, the operating margin held close to Q2, while gross margin, net margin and operating cash flow as a share of revenue fell.1, 2
Palantir’s operating margin holds as cash conversion falls
Q2 2026 versus Q3 2026 · Percent of quarterly revenue · GAAP measures
Operating cash flow fell to 52.1% of revenue.
Each row uses the same 0–100% scale. Circles show Q2; squares show Q3. Operating cash flow is a cash-conversion measure, not an income margin. This comparison covers two quarters and does not establish a trend.
Source: Palantir Q2 and Q3 2026 earnings releases; TGOs calculations · As of November 2, 2026.1, 2
Cost of revenue grew 29.1% sequentially, faster than revenue, accounting arithmetically for the gross-margin decline.1, 2 The release does not explain the Q3 cost increase. The June-quarter filing attributed that quarter’s year-over-year increase mainly to third-party cloud hosting, but it does not establish the Q3 driver.6
Below operating income, other income and expense swung from $91.8 million of income to $25.8 million of expense. That adverse swing helps explain the lower net margin even as operating income increased.1, 2 The release does not itemize the other-income line.
Receivables absorb cash while the balance sheet accumulates funds
Operating cash flow was $1.205 billion, little changed from Q2 and more than double the year-earlier quarter.1, 2 For the first nine months, operating cash flow grew 144.6% year over year.1
Operating cash flow also fell between the second and third quarters of 2025, from $539.3 million to $507.7 million.1, 2 Revenue increased over that interval.5 The latest sequential cash comparison alone does not establish a deterioration in collection performance.
Accounts receivable grew 26.8% during Q3, faster than quarterly revenue, and absorbed approximately $409.6 million of cash. Higher contract liabilities contributed approximately $140.5 million of cash.1, 2 These are separate working-capital movements, not a complete cash-flow bridge. The release does not explain the receivables increase.
Adjusted free cash flow was $1.216 billion. It exceeded operating cash flow because the $19.5 million cash payroll-tax add-back exceeded $8.0 million of capital spending. The payroll taxes relate to stock-based compensation; capital spending comprises purchases of property and equipment.1
Nine-month purchases of property and equipment totalled $30.0 million.1 Meanwhile, balance-sheet cash, cash equivalents and marketable securities reached $10.562 billion, increasing approximately $1.152 billion during Q3. This comparison uses the balance-sheet categories consistently; the releases’ Treasury-securities highlights use different categories.1, 2
The higher outlook includes a higher fourth-quarter expectation
Palantir raised its full-year revenue forecast to $8.530–$8.534 billion, representing company-stated growth of 91%.1 The successive forecasts show how far the expected revenue base has moved since February.1, 2, 3, 4
Palantir raises its full-year revenue outlook
FY 2026 revenue guidance · USD billions · All ranges are forecasts
The latest outlook represents 91% growth, as stated by Palantir.
Range positions use a $7.0–$9.0 billion axis. Hatched marks show the exact forecast ranges; their narrow widths reflect the company’s guidance. These are not bars measured from zero.
Source: Palantir Q4 2025, Q1 2026, Q2 2026 and Q3 2026 earnings releases · As of November 2, 2026.1, 2, 3, 4
Q3 revenue exceeded the top of the August quarterly forecast by approximately $149 million.1, 2 The full-year increase also embeds approximately $227 million more Q4 revenue than the August outlook implied when corresponding low and high endpoints are paired. That comparison is approximate because it uses rounded quarterly figures.1, 2, 3
Palantir now forecasts Q4 revenue of $2.649–$2.653 billion.1 Against rounded prior-year revenue, that implies roughly 88%–89% year-over-year growth, below Q3’s rate.1, 4 A higher dollar outlook can therefore coexist with a lower growth rate.
The U.S. commercial forecast is in excess of $3.559 billion for the year, with growth of at least 143%.1 That full-year floor implies Q4 U.S. commercial revenue above an approximate $1.216 billion threshold, using rounded nine-month U.S. commercial revenue.1, 2, 3
Full-year adjusted operating income guidance is $5.245–$5.249 billion. Paired endpoints of the Q4 revenue and adjusted operating income forecasts imply an adjusted operating margin of about 62%, close to Q3’s level. Palantir has not reconciled its forward non-GAAP guidance to GAAP.1
Palantir also raised its annual adjusted free cash flow forecast to $4.8–$5.0 billion.1 After subtracting the rounded nine-month total, that requires approximately $1.439–$1.639 billion in Q4. Both ends exceed Q3’s $1.216 billion of adjusted free cash flow.1, 2, 3 The release does not explain where the required increase will come from.
Sources (6)
- Palantir Q3 2026 earnings release, November 2, 2026
- Palantir Q2 2026 earnings release, August 3, 2026
- Palantir Q1 2026 earnings release, May 4, 2026
- Palantir Q4 and full-year 2025 earnings release, February 2, 2026
- Palantir Q3 2025 earnings release, November 3, 2025
- Palantir Form 10-Q for the quarter ended June 30, 2026